Illuminating the Potential of Solar Energy in the UK
by Tony Griffiths Olsights CEO & Technical Director
Introduction
Solar PV is intriguing: It’s such a simple principle to understand (i.e. we know we can get sunburned in some locations, at some times), but the dynamic and variable behaviour of solar energy can be difficult to grasp. Trying to work out whether a solar PV project has all the ingredients to produce an economic return is even more complex. Consider the following opportunity:
- Solar is the most abundant source of energy, with net solar input to Earth more than 6,000 times the rate of fossil fuel use.
- It is cost effective compared to other renewable energy sources, and a low carbon way to power our activities compared to today’s grid.
- Solar PV is within reach of many home and business owners, and rooftop solar is a simple & accessible project that can save money long-term without complicated planning, and without affecting land use.
- Much of UK is great for solar! Used in the right places, it is a quick way to support a low carbon future, reduce energy bills and create home-grown permanent high quality local jobs.
In order to help me understand the technology close-up and save on energy bills, I installed solar PV panels at home a couple of years ago, and recently fitted battery storage to take advantage of agile power tariffs available. I will summarise some initial thoughts on how that is working out.
Most of us have caught a glimpse of random solar farms whilst on journeys somewhere, but probably don’t know the extent to which they have been – and continue to be – developed. I had some surprises recently at how much solar capacity is installed and planned in some parts of the UK, despite UK not being known as a particularly sunny climate in global terms – so will summarise some key analysis on where + when these are happening.
In this post I will focus exclusively on the UK solar opportunity and development pipeline, with a case study on my home patch of Anglesey- but the principles are global, and scalable on many levels from individual rooftops to ‘power station replacement’.
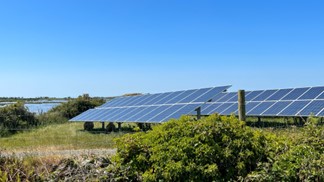
A Solar Farm in Wales
Where does the energy come from?
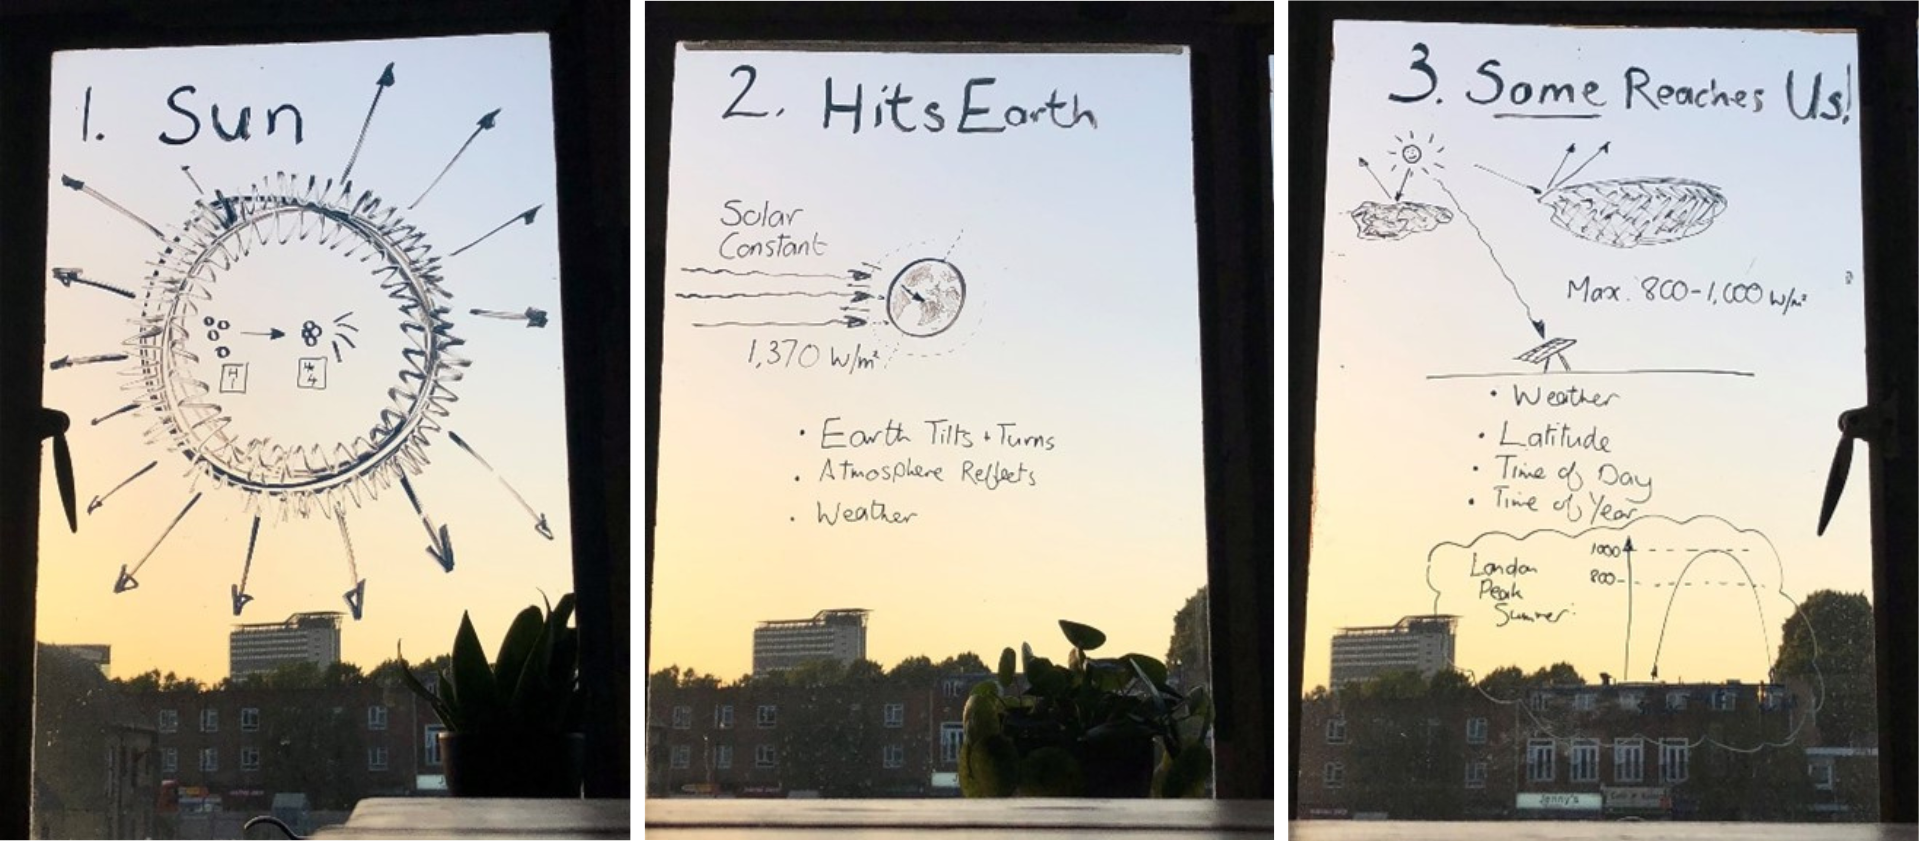
If you thought that nuclear fusion is ‘always 30 years away’, you may be surprised to know that we’re already enjoying its heat: The sun is a massive nuclear fusion reactor that crushes hydrogen atoms together under such gravity that they form helium atoms – and in the process release huge amounts of energy. The radiation shines out in all directions, travels through the vacuum of space – and some of this remote stellar fusion reaches our planet.
Solar radiation hits the Earth’s atmosphere at a fairly constant power of around 1370 W/m2 (“the solar constant”), and this is the limiting factor in how much of the sun’s energy we can harness. Due to reflection back into space and diffusion through the atmosphere and such things, even on a cloudless day the amount of sun that hits the Earth’s surface will be less than this: In London for example the peak summer solar irradiance is in the range 800 – 1000 W/m2.
Solar Radiation Explained
How Sunny?
According to Global Solar Atlas, there is considerable variation in the solar irradiance across the UK, partly due to latitude – but also due to localised weather conditions and resulting cloud cover etc.
For example if we consider Anglesey (my home area, also now a Freeport): The West of Anglesey and the port of Holyhead has an annual Solar PV output of 1060-1070 kWh per kW of installed capacity: This is comparable with Cornwall and southeast England (the best locations in the UK for solar output). In the east of Anglesey (15-20 miles away) however the annual Solar PV output is lower, at 990-1000 kWh per kW of installed capacity. So there is up to 8% difference in output for the same solar panels between one end of the island and the other, due to cloud cover variation. Despite the difference though the whole island is well placed for solar and making power from the sun.
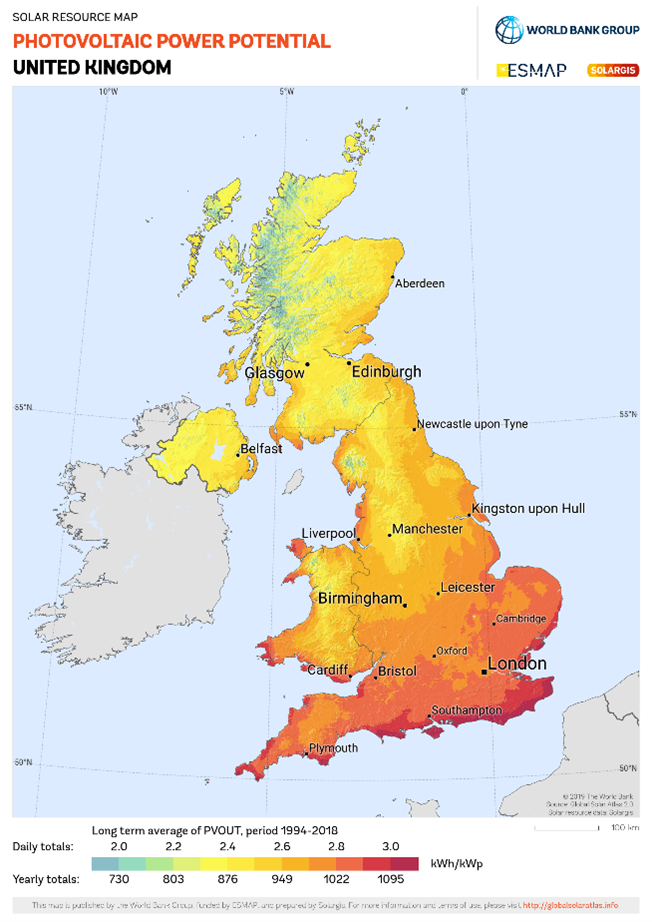
UK Predicted Solar PV Output (credit – Global Solar Atlas)
The same is true around east London / Thames Estuary (which is also now a Freeport): At Dagenham which is the closest part of the estuary area to London, it has an annual Solar PV output of around 1040 kWh per kW of installed capacity; further down the estuary around Port of Tilbury and then the London Gateway logistics hub/ Thames Enterprise Park the annual Solar PV output is slightly higher, at 1060-1070 kWh per kW of installed capacity.
Around much of Wales, Scotland and northern England the solar power potential is lower, with annual outputs in the range 800 – 900 kWh per kW of installed capacity (10-20% lower than in Anglesey). This affects economic evaluation of projects, and project siting.
The Shape of Utility Scale Developments:
There’s a significant amount of solar capacity installed and planned for UK, which we’ll examine.
One thing that surprised me the most was the amount of solar development capacity in Scotland (which is not a place known for being sunny): Around 3,100 MW of utility solar PV capacity is in the pipeline, with around half of this currently installed, or in construction. For context, that is in the order of a tenth of typical daytime entire UK power demand.
The shape of distribution of these solar farms in Scotland is interesting and on initial inspection suggests flat sunny land – which likely also makes these areas the best agricultural land and would pose a competition for agricultural use. Aberdeenshire – in Scotland’s northeast which faces the fierce North Sea – has by itself a solar PV capacity of 690 MW across 47 solar farms.

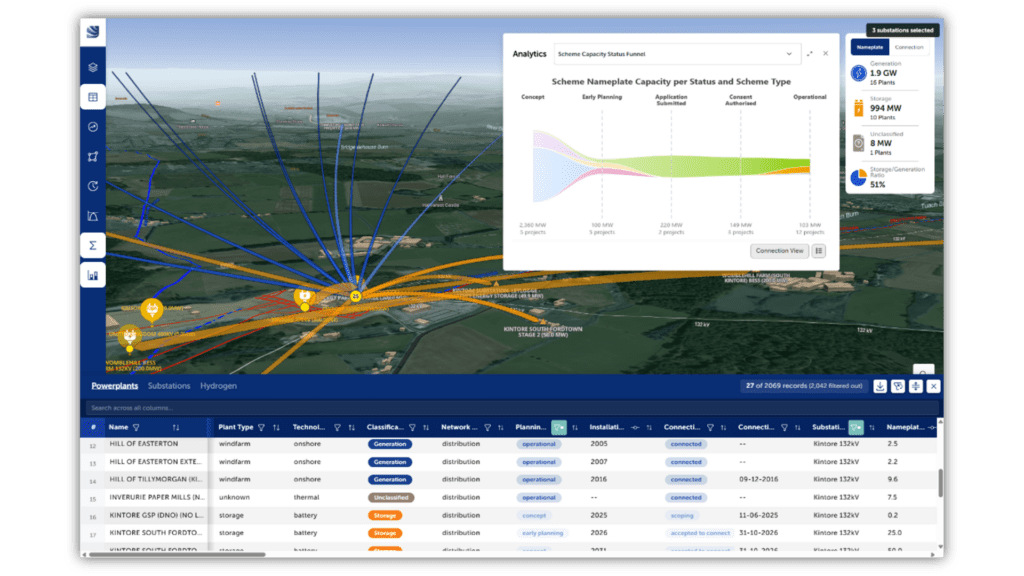
Distribution of Solar Farms in Scotland shown on the Olsights Eye
I was surprised also to see that Scotland’s solar capacity (installed + planned) is around 50% greater than that of Wales (which has the advantage of higher irradiance) which has 2,100 MW. Both Scotland’s and Wales’ solar capacities are however dwarfed by England’s solar capacity – which comes in at over 30,000 MW. This brings total UK utility-scale solar capacity to around 36,000, which is in the order of typical UK daytime power demand.
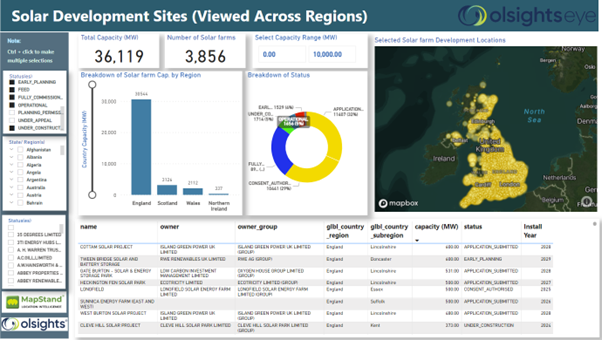
Solar Developments Dashboard on the Olsights Eye
These development numbers do not include the 4,000 MW or so of applications that have been refused, withdrawn, expired or abandoned etc for various reasons.
If we examine the UK’s breakdown of UK solar capacity on a county-by-county basis, Lincolnshire alone stands out with a capacity of 3100 MW, which is the same for the whole of Scotland. Essex is a runner-up with a capacity around 1700 MW, then Kent and Suffolk each with around 1300 MW capacities.
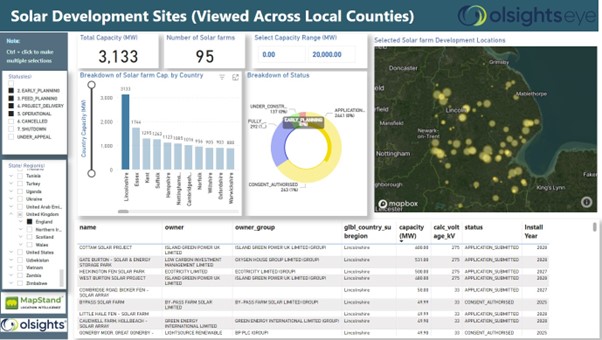
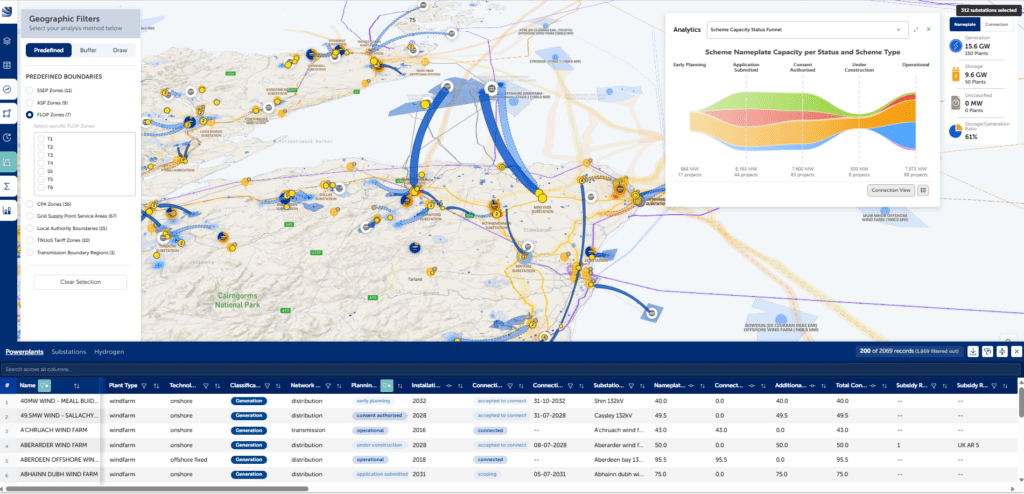
Solar Development Sites Dashboard on the Olsights Eye
At the time of writing, the solar farm output record for the UK was 10,971 MW, set in April 2023. This ties in well with the current entire installed capacity for UK Utility Solar PV at around 10,600 MW.
When examining the capacities in various stages of development, there is more than double the amount of installed capacity in advanced planning stages (21,900 MW) compared to that currently in operation (10,600 MW), and while not all of the planned developments can be expected to reach Final Investment Decision (FID), expect a rapid increase in installed output towards 20,000 MW (20 GW) in the coming few years. Around 1700 MW of solar capacity is shown as being currently in construction.
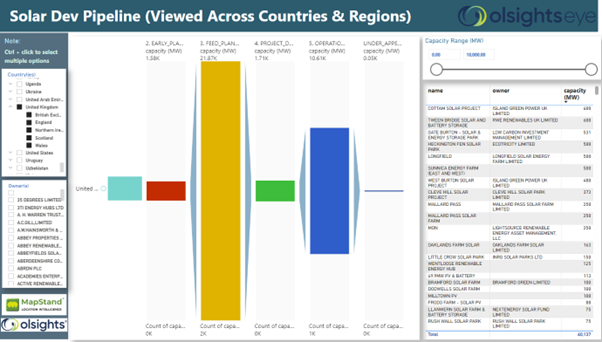
Solar Development Pipeline in the UK on the Olsights Eye
At the time of writing, the recorded output record for solar farms the UK was 10,971 MW, set in April 2023. This ties in well with the current entire installed UK capacity of 10,600 MW.
These planned developments are still some way off the ‘70 GW by 2035’ target set in the British Energy Security Strategy, although that target does also include rooftop solar installations (which are not included in this analysis above), as well as large utility scale.
Utility-Scale Grid Connections:
Generating power from Solar generally requires a connection to the grid, even if the bulk of the power generation is used ‘behind the meter’. Most of the Distribution Network Operators (DNOs) have heatmap tools that show the level of constraint for connection, and the total capacity that is connected/ planned to be connected at each substation. We’ve aggregated many of these online grid connection tool resource on this web page to help keep them in one place.
In Scotland, DNOs own all infrastructure up to 33kV, whilst in England and Wales the DNOs own the 132kV infrastructure as well. Because of the proliferation of generation scheme applying to connect to the grid over the last 10 years, the online DNO heat maps tend to show that the 132kV, 33kV and 11kV grid and its substations is generally ‘constrained’ (mainly red). Further information on the ease of connection is often only available through applying for a grid connection. Above those voltages, the infrastructure is owned by the Transmission Owners (TOs) and the connections process managed through National Grid Electricity System Operator (ESO). There is currently no ‘heat map’ for the transmission networks, but the Transmission Entry Capacity (TEC) Register contains information on accepted connections linked to each substation.
This means that local large scale solar PV is likely to be difficult to connect to. The complication is that DNOs and TOs have a steady ongoing programme of reinforcing capacity in circuits and substations, and are planning to modernise in the next 5 – 15 years. Further 132kV and 33kV reinforcement to support the growing local network of generation projects may be available after 5 years in many areas.
Utility scale solar may require in excess of 20 acres of land space, and one concern often expressed by locals and politicians is that this could take away from high grade agriculture land and has a negative visual impact.
Home Installations:
From 2010 – 2019, solar panel and system costs reduced by 85%, and they no longer need subsidies to pay back installation costs. The recent inflationary rise in material & work costs since 2022 is still offset by the savings made through avoiding or exporting higher electricity costs. They can be a great investment, and the resulting unit cost of solar electricity over a long operating life can be as low as 5p-10p/kWh depending on scale. Comparing this with current typical domestic tariffs of 30-40p/kWh this represents a big saving. As a guide for small to medium scale Solar PV installation (without battery), costs are in the range of £800 – £1600 per kW of installed capacity.
Solar PV is a lower carbon way to power home, electric cars and industry compared to grid power which is still largely gas-fired, although there is a commitment to decarbonise the UK grid by 2035. Almost all buildings are suitable for Solar PV panels on the roof. South-facing sloping roofs work best, but east or west-facing roofs also work well. There are also potential options to install panels in garden fences.
A typical 1m x 2m sized modern panel will be rated for 400-500W, so a typical 3 – 4kW system will need 6 – 10 panels, but sizing should be matched to actual power demand & usage patterns (talk to your local installer for optimisation options). Impartial advice can be obtained from organisations such as the Energy Savings Trust, and there are grants available in some regions to help cover the costs of installation.
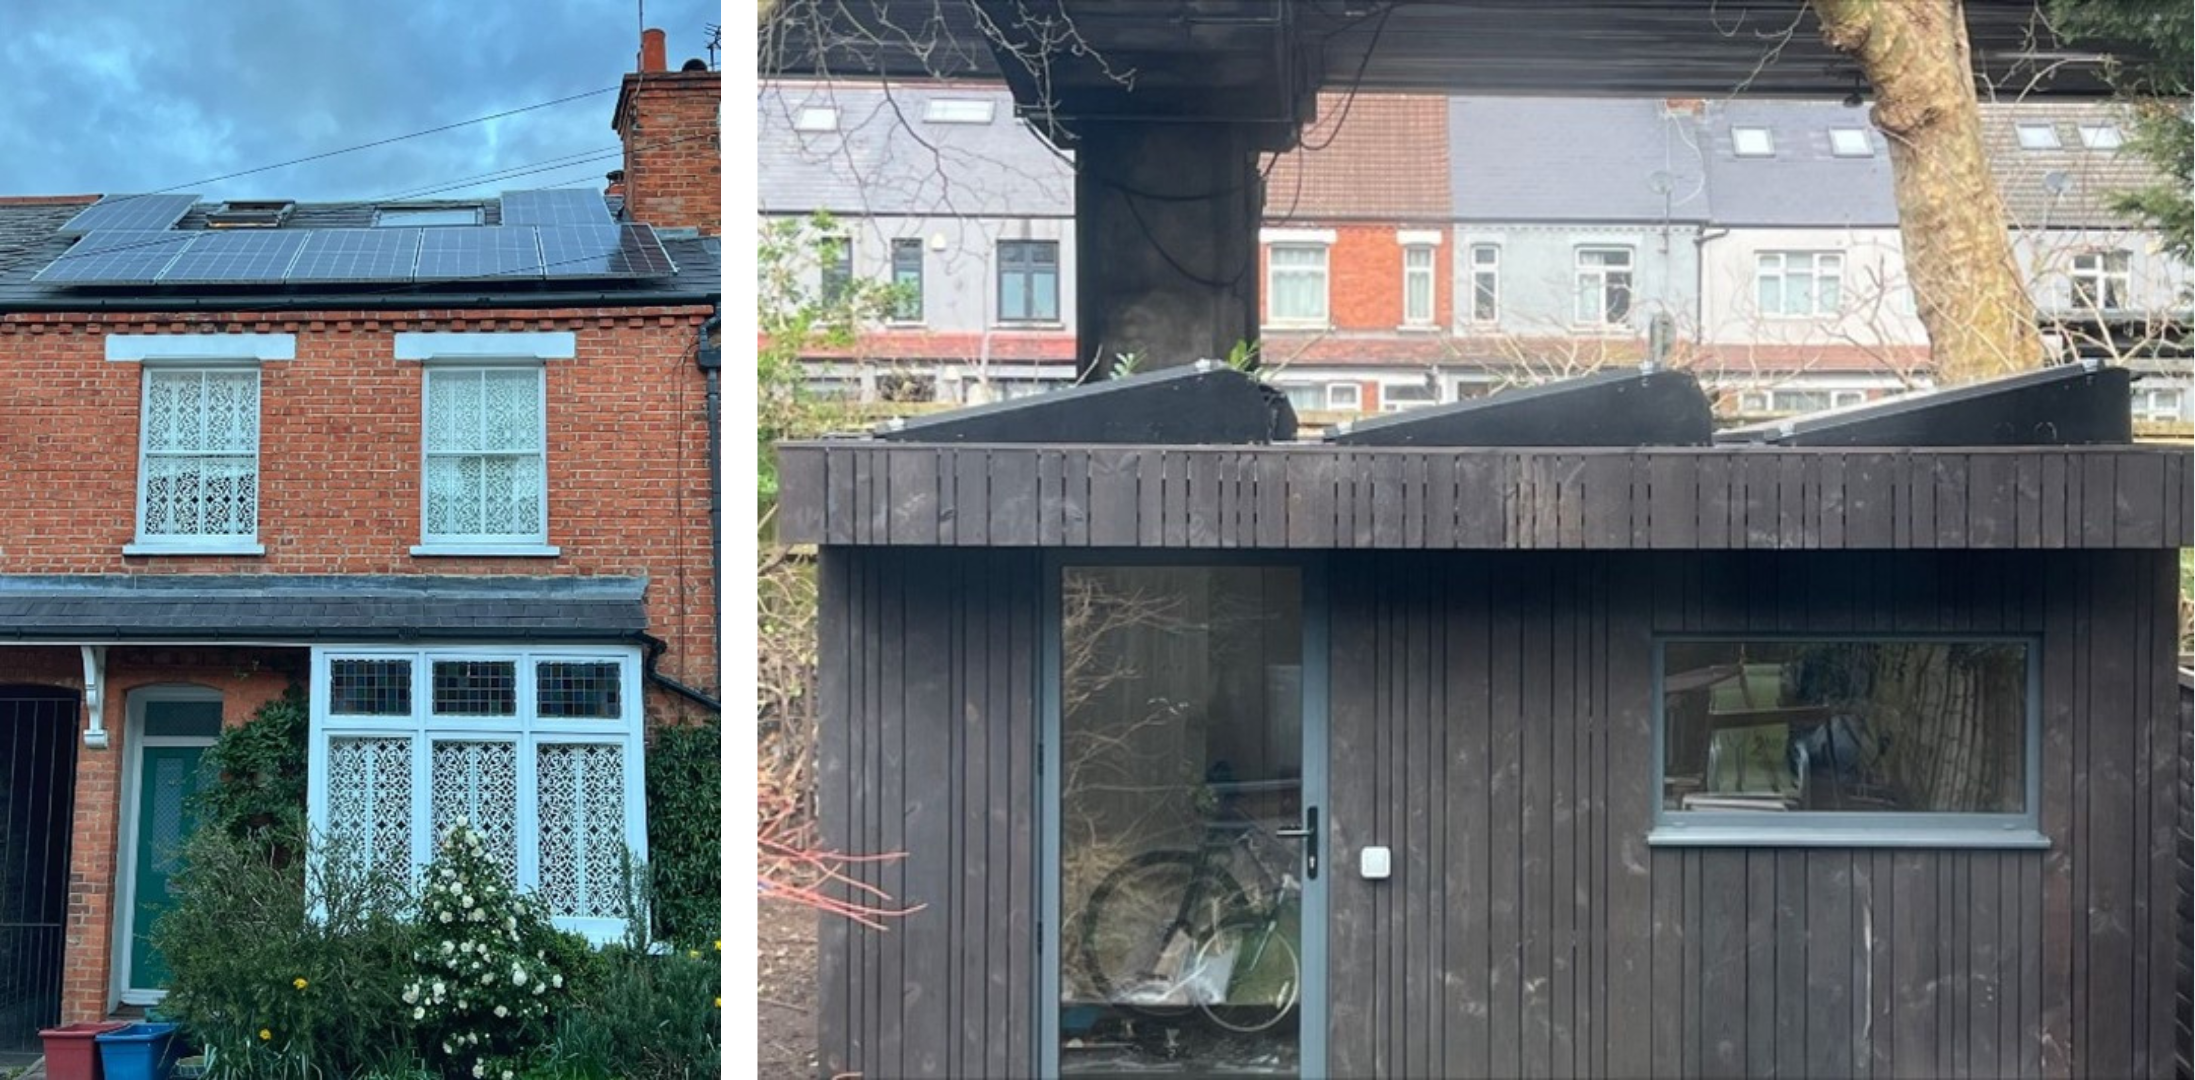
Residential Urban Solar PV
Battery storage costs have dropped in recent years, but still add significant cost to a solar project – and may not be worthwhile unless a homeowner is able to take advantage of flexible or ‘agile’ tariffs that allow the battery to load up when power is cheap, then export to the grid at maximum cost during peak demand times. I realised over the last year or so that the real enthusiasts for solar panels & batteries etc were not so much energy geeks, but finance folks (CFOs and accountants etc); they seem to just get these schemes as a financial no-brainer.
At home we recently installed a 9.5kWh battery and a GivEnergy hybrid inverter to do this, and even in the bleak depths of winter and living in a mid-terraced house in London we were able to export more power than imported on a day in mid February.
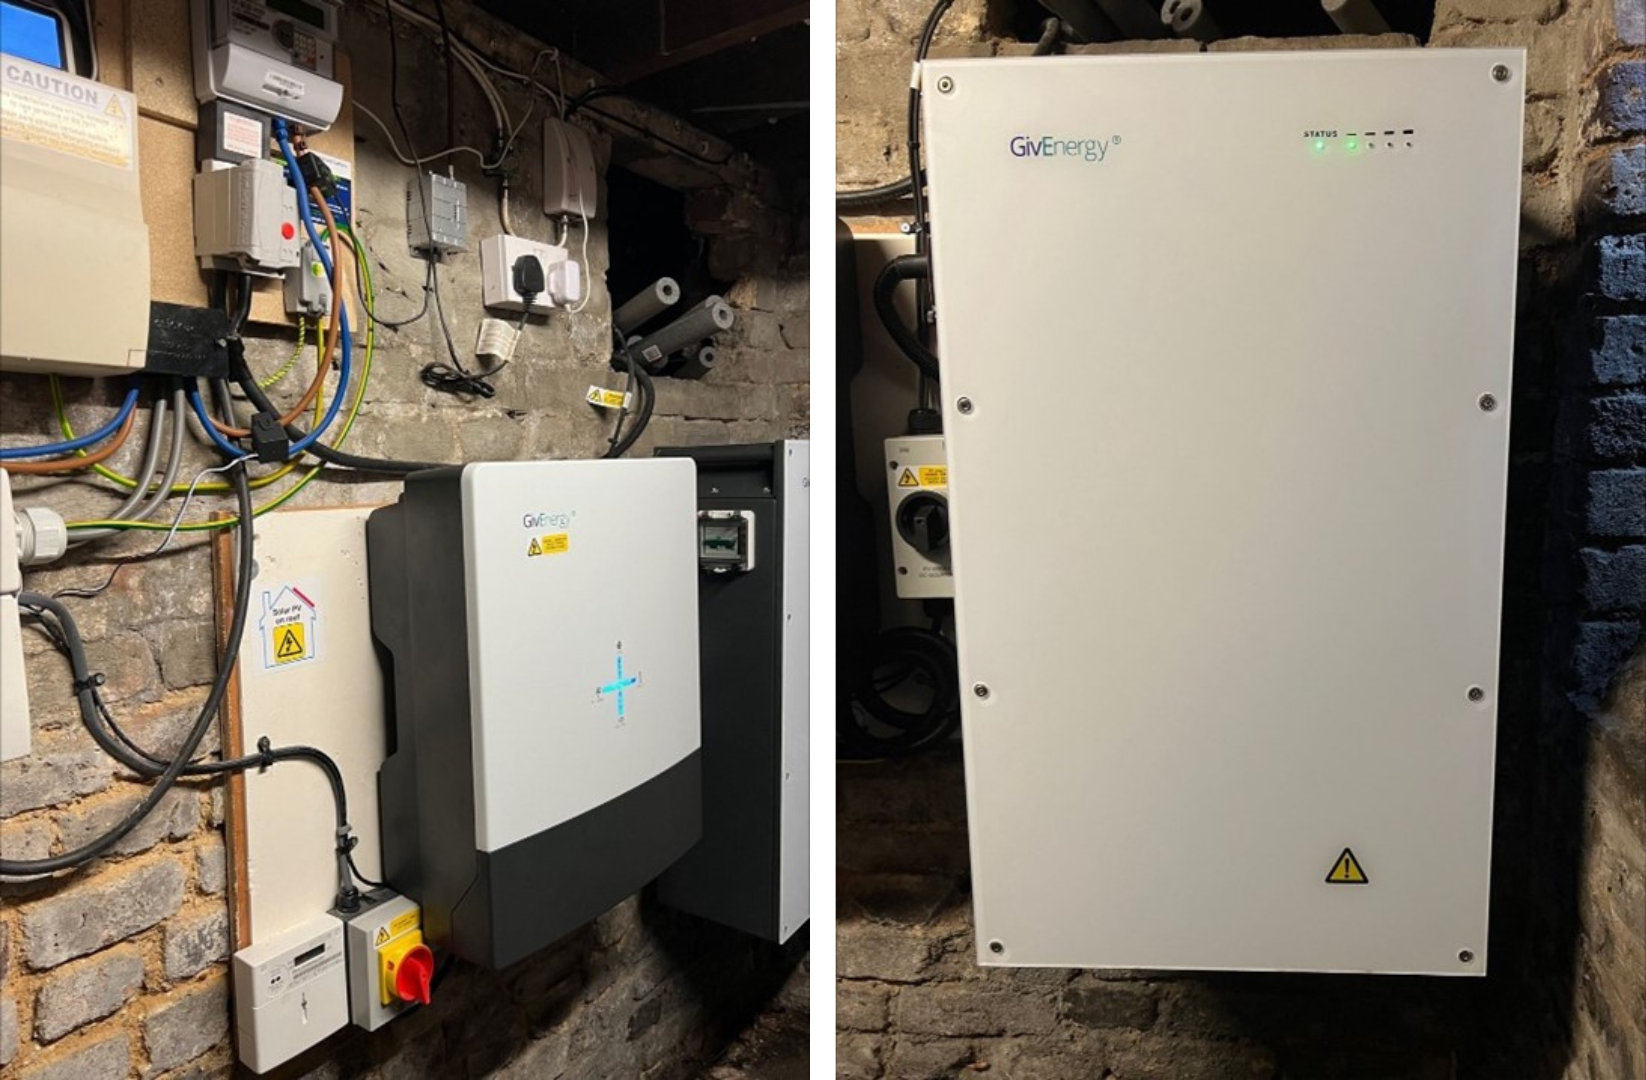
Residential Battery and Hybrid Inverter
The new battery meant we could sell to grid when our Octopus Energy tariff was highest at 4-7pm. Some key numbers from our GivEnergy app for that day can be summarised as:
- Total Solar PV generation = 12.3 kWh
- Total export to grid = 14.8 kWh (at 26 – 35p/ kWh)
- Total import from grid = 7.4 kWh (at 26p/kWh)
These are small numbers really, but give an indication of how a solar PV system with storage may work on a bigger scale.
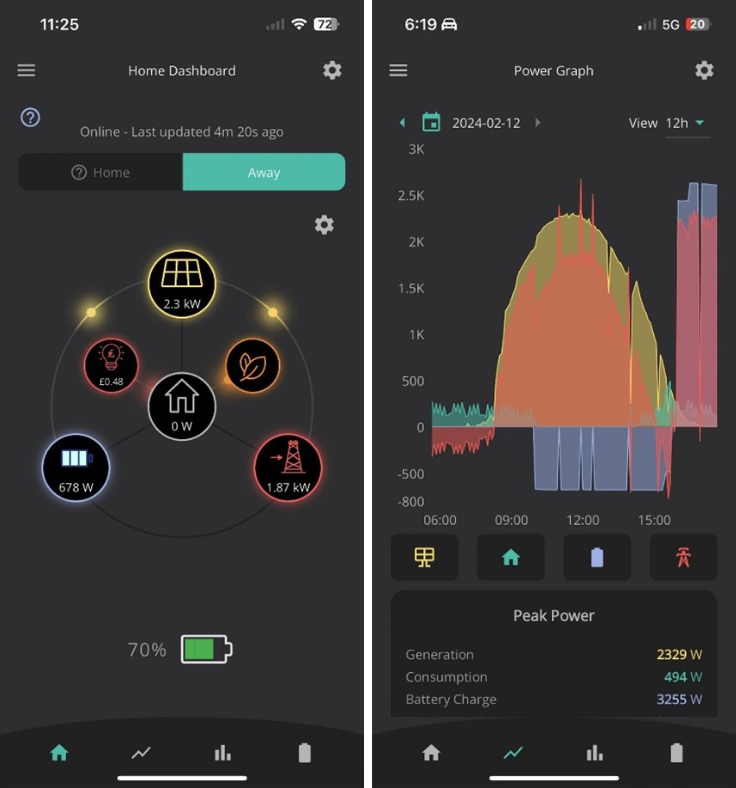
Residential Solar Dashboards
The Middle-Ground: Landowners + Commercial:
Although it may be difficult to connect large capacity solar schemes to the grid, it may be possible for lower voltage circuits <1kV to be used for connecting less than 0.2 MW (200 kW) capacity to the grid, suitable for land owners, farmers and local authorities.
Landowners can take advantage of medium scale solar by installing larger scale roof top solar on to existing industrial and commercial building roofs or replacing land boundary fencing with solar panels. Such ideas can help reduce power costs without affecting land use.
Above ~200 kW, grid connection and planning processes are more complex due to the higher 6.6 – 11 kV voltages, as well as the DNO and Council planning constraints. It can take up to a year from submitting development planning to delivery.
Such projects can be delivered within 4 – 12 weeks. Developers can choose to feed surplus energy to grid or store in battery depending on electricity demand..
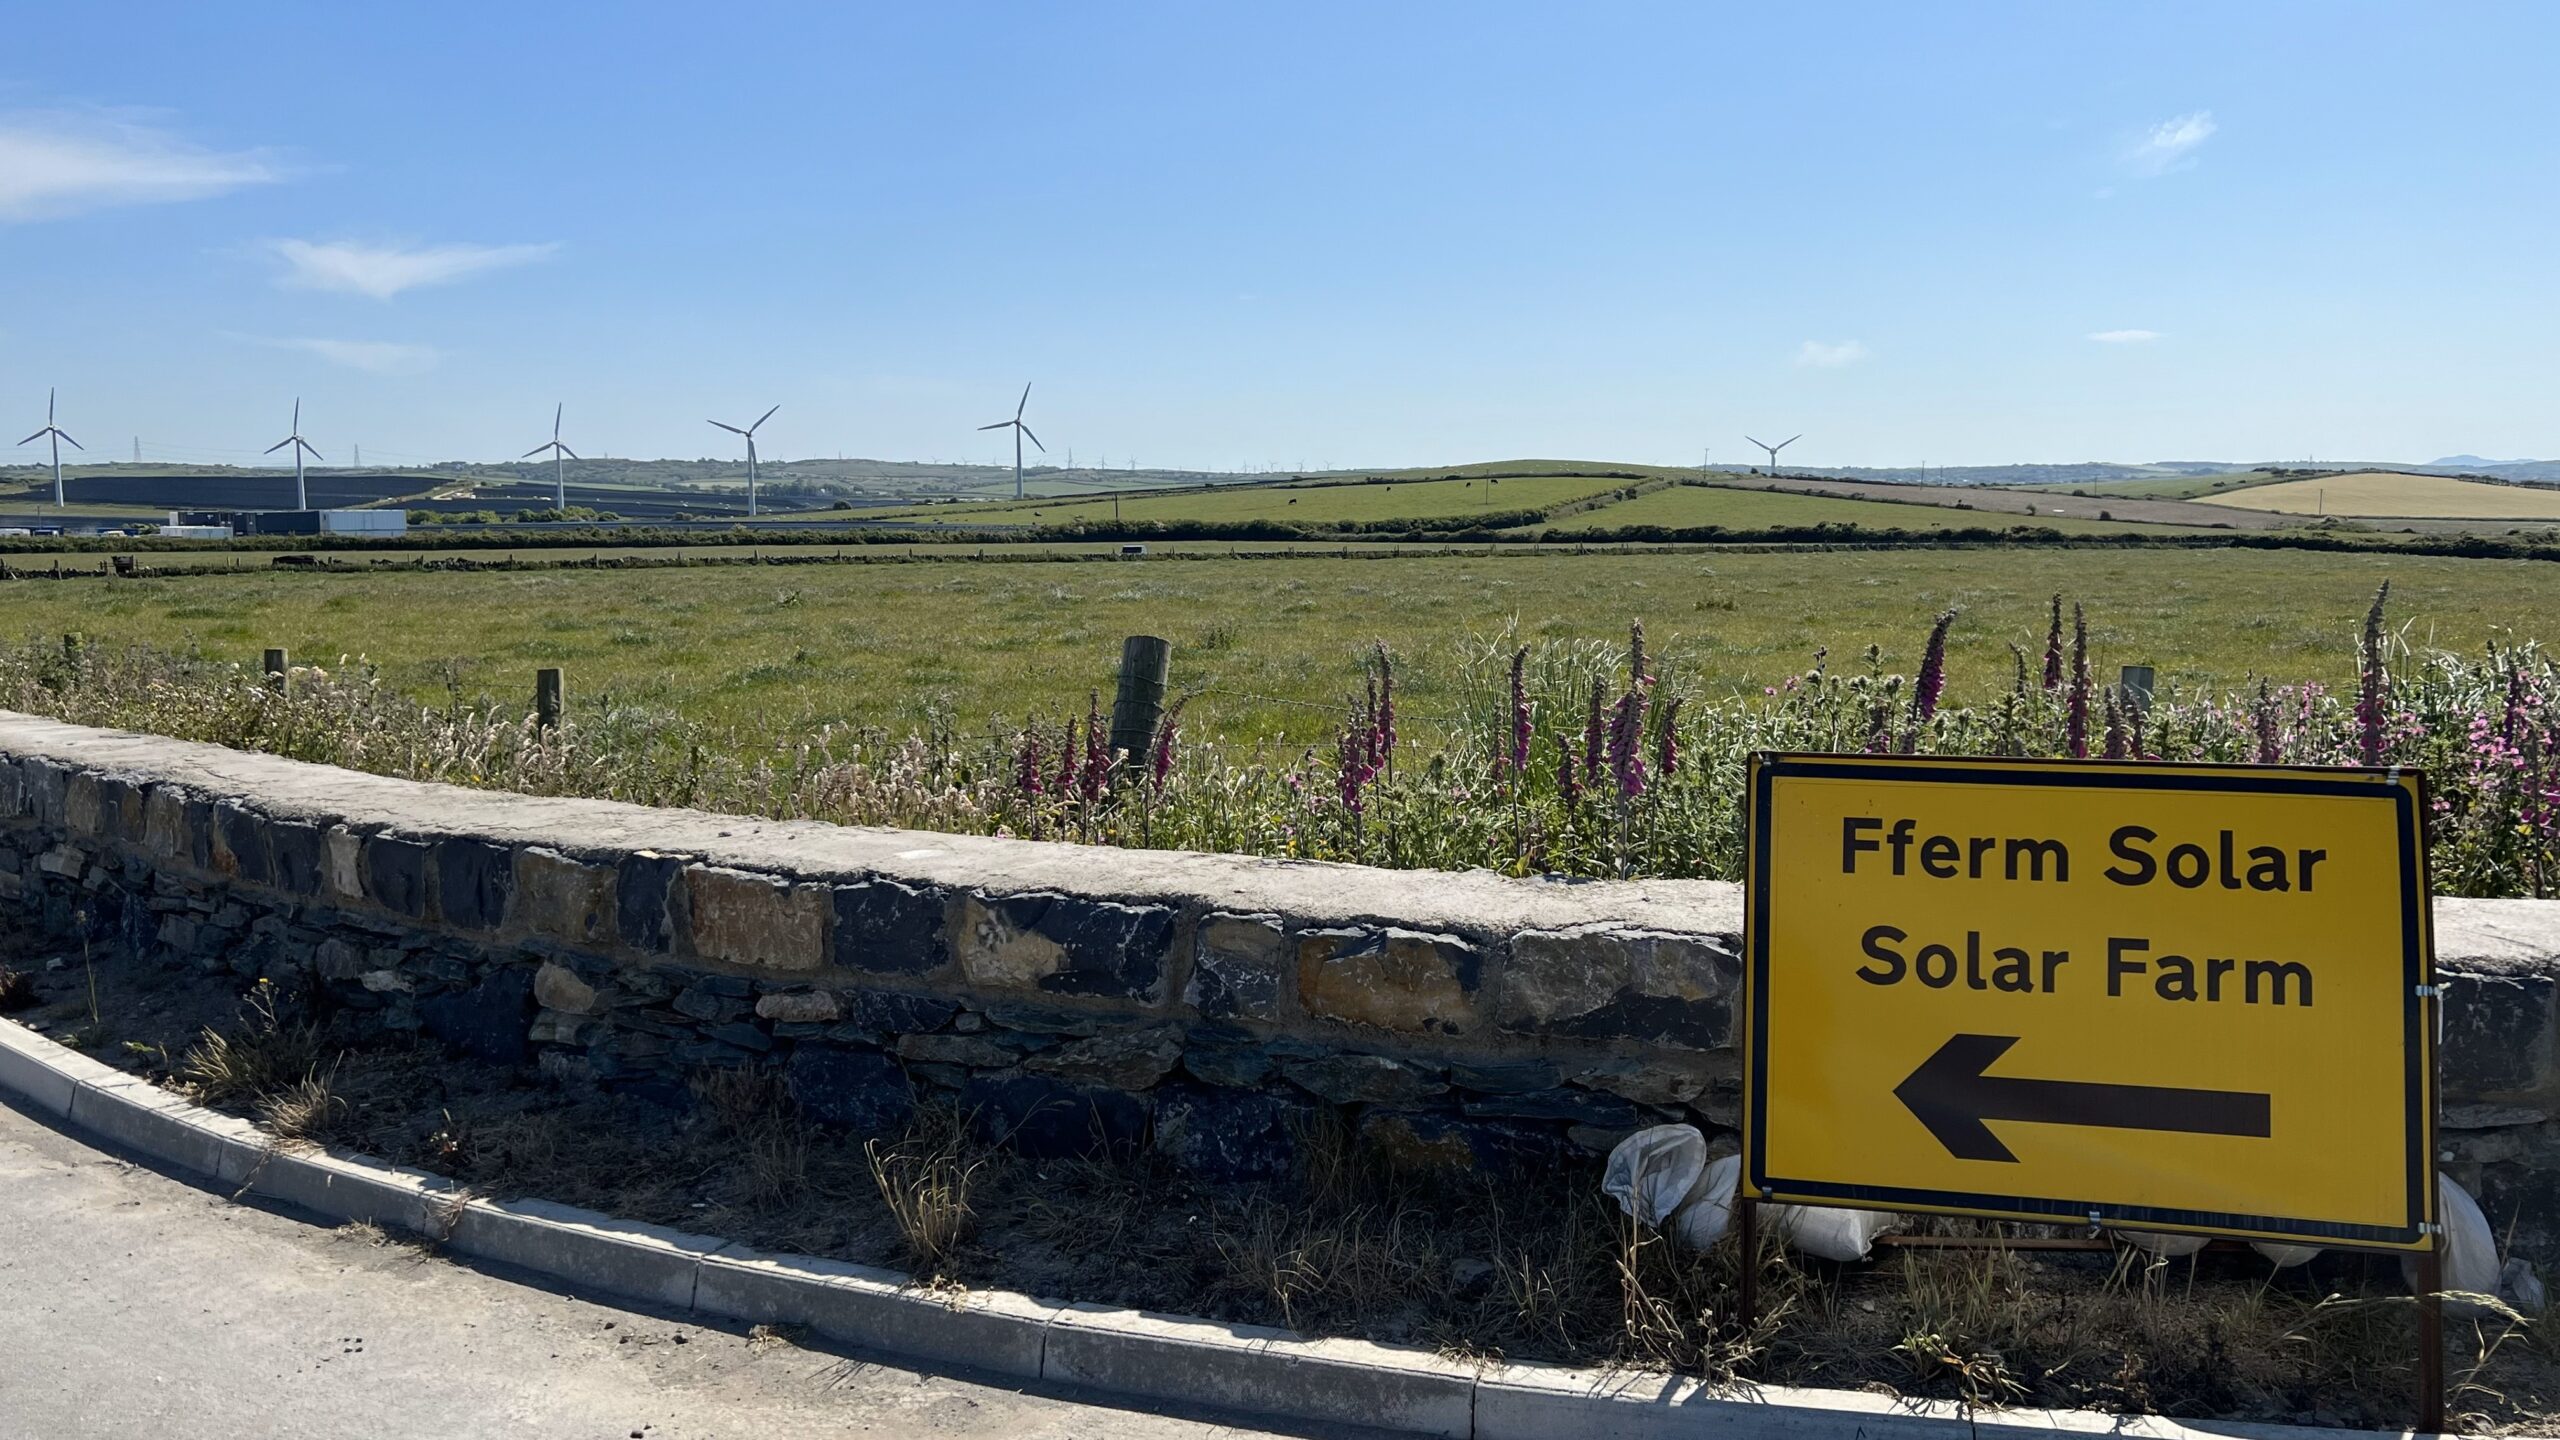
Solar Farm Sign Anglesey
How can Local Authority or Commercial Organisations Make Best Use of Available Space?
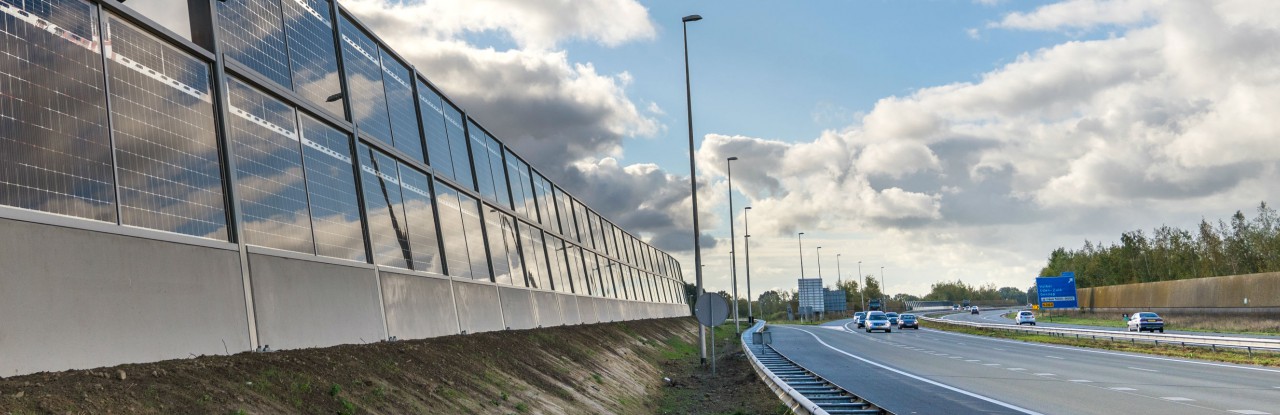
Solar highways are a concept that combines traditional highways with solar panels to produce renewable energy. By utilising the empty space around the roads, solar highways have the potential to generate a significant amount of energy while also reducing carbon emissions.
The length of the A55 crossing the island is approximately 40km long, Making use of space along the verges and central reservations could generate a significant amount of energy, enough to potentially power entire towns and villages.
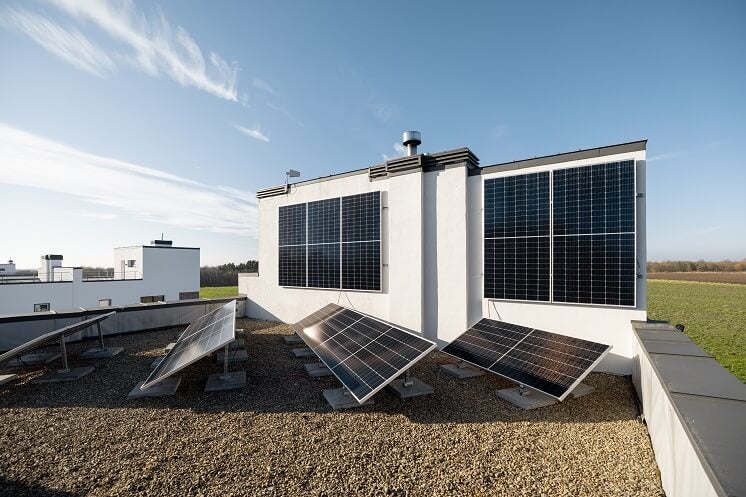
Retrofitting vertical solar panels to buildings is a sustainable way to generate renewable energy. These panels can be installed on the sides of buildings, taking advantage of the vertical space and reducing the need for additional land. In addition, vertical solar panels can be integrated with the building’s design, providing an attractive and efficient solution for energy production. Retrofitting buildings with vertical solar panels can help reduce carbon emissions and promote a cleaner, greener future.
There have been many exciting new innovations in the field of solar energy in recent years.
One such design is the innovative Naked Energy hybrid tube solar panel that generates both power and hot water simultaneously at no loss of efficiency.
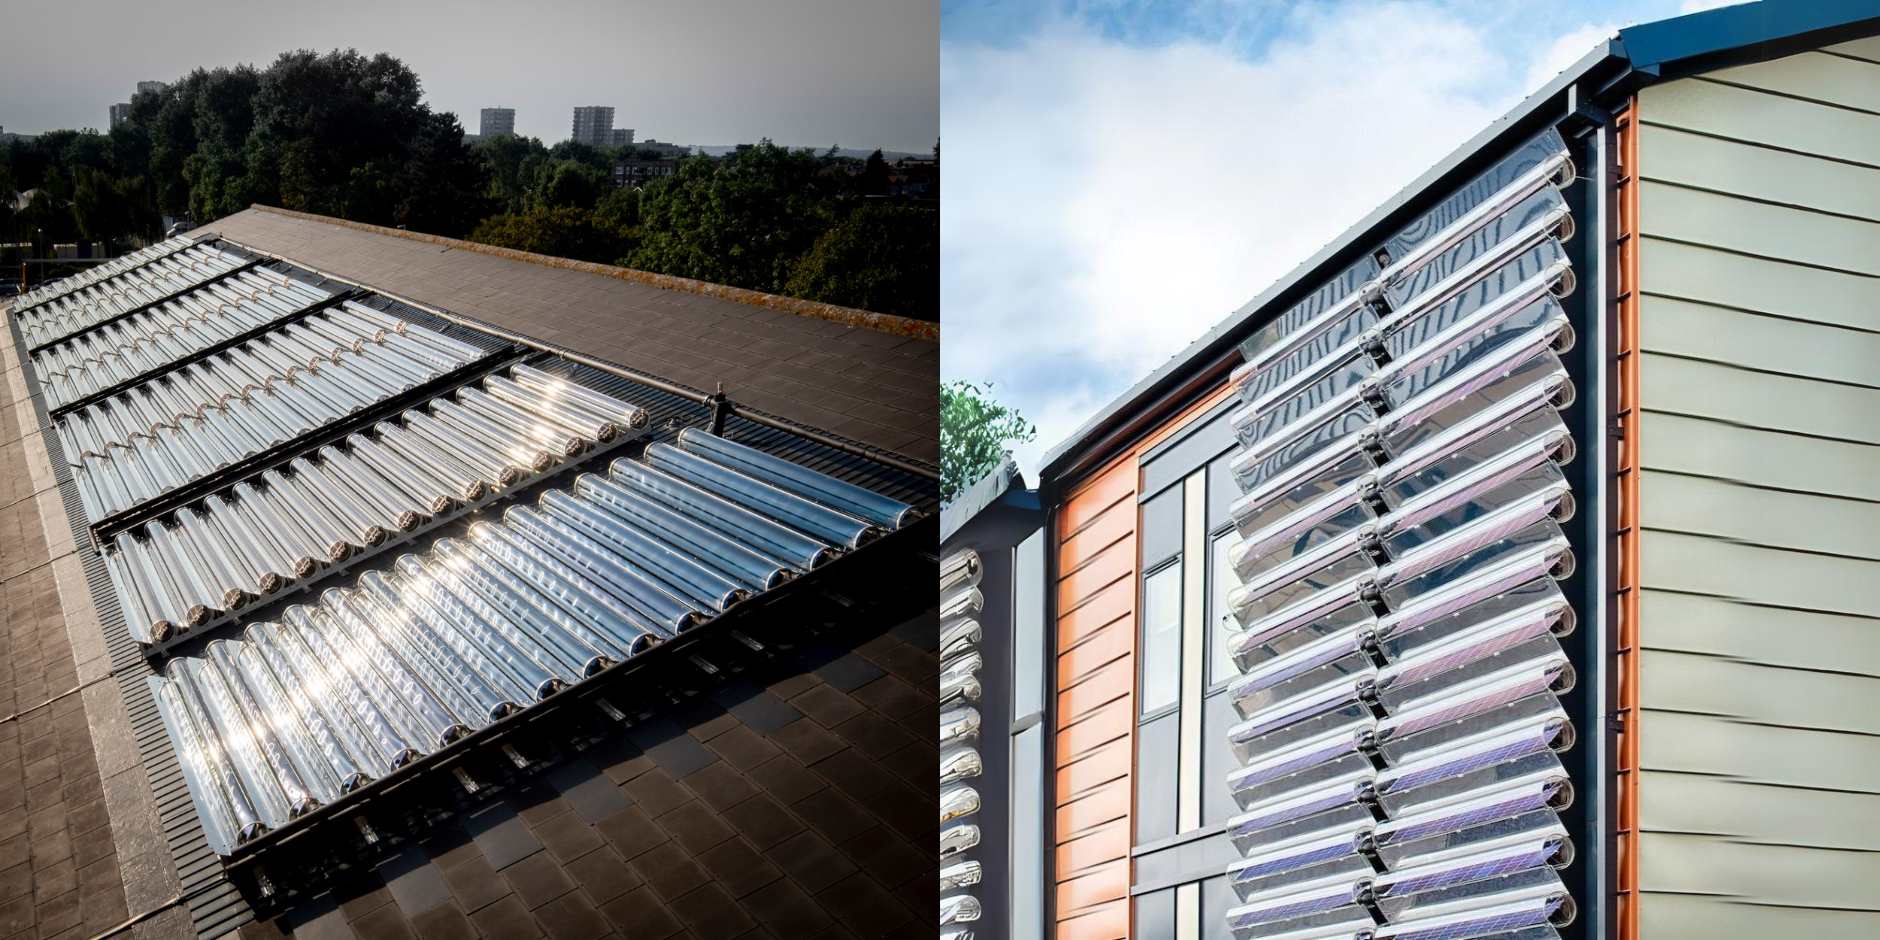
Naked Energy Virtu Panels Credit – Naked Energy
Another is the use of thin-film solar panels, which are lightweight and flexible, making them ideal for use on curved surfaces and in areas where traditional solar panels are not feasible.

Thin Film Solar Panels – credit Solar Fast
More Info:
Some open resources are shared below for reference; please contact us for access to Olsights analytic dashboards/ tools or bespoke analysis.
- Global Solar Atlas (World Bank Group): https://globalsolaratlas.info/
- Downloadable Map of UK Solar Output from Global Solar Atlas (World Bank Group): https://globalsolaratlas.info/download/united-kingdom
- Energy Dashboard App: https://www.energydashboard.co.uk/live
- National Grid ESO grid status app (Apple version): https://apps.apple.com/gb/app/the-national-grid-eso-app/id1469935379
- British Energy Security Strategy (UK Gov): https://www.gov.uk/government/publications/british-energy-security-strategy
- Transmission Entry Capacity (TEC) Register (National Grid ESO): https://www.nationalgrideso.com/data-portal/transmission-entry-capacity-tec-register/tec_register
- Givenergy hybrid inverters: https://givenergy.co.uk/products/hybrid-inverter/
- Intelligent Octopus Flux Tariff (Octopus Energy): https://octopus.energy/smart/intelligent-octopus-flux/
- Energy Savings Trust advice: https://energysavingtrust.org.uk/advice/solar-panels/
- Olsights-compiled solar web tools: https://olsights.com/insights/solar/
- Olsights-compiled grid connection web tools: https://olsights.com/insights/gridconnections/
- Olsights Eye spatial app: https://app.olsights.com