In school I wasn’t that great at geography: I got a C in my GCSE, and then dropped it soon as I could to pursue the holy trinity of maths, physics & chemistry.
But after a career of living & working overseas in the oil & gas industry, and studying in detail how different types of energy developments can be made to work in different geographies, environmental settings and cultures – I absorbed first-hand some of what geography is about. I now find myself at the ripe age of nearly 50 reaching out for more and more ‘geography lessons’ as they relate to energy transition + what developments are required to make that happen.
Last Christmas my daughter gave me Tim Marshall’s book ‘The Power of Geography’ which describes how unique geographies have shaped historical fortunes, national cultures, industrial strategy and political alliances – a fascinating read!

Bedtime read: The Power of Geography by Tim Marshall
And after starting to learn recently how to use Mapbox as a platform for visualising our energy datasets, this week I discovered the excellent informative Mapbox Styling Webinar by Jonni Walker where he shares tips for some of the dark arts of terrain styling, hillshading, water features and the like:
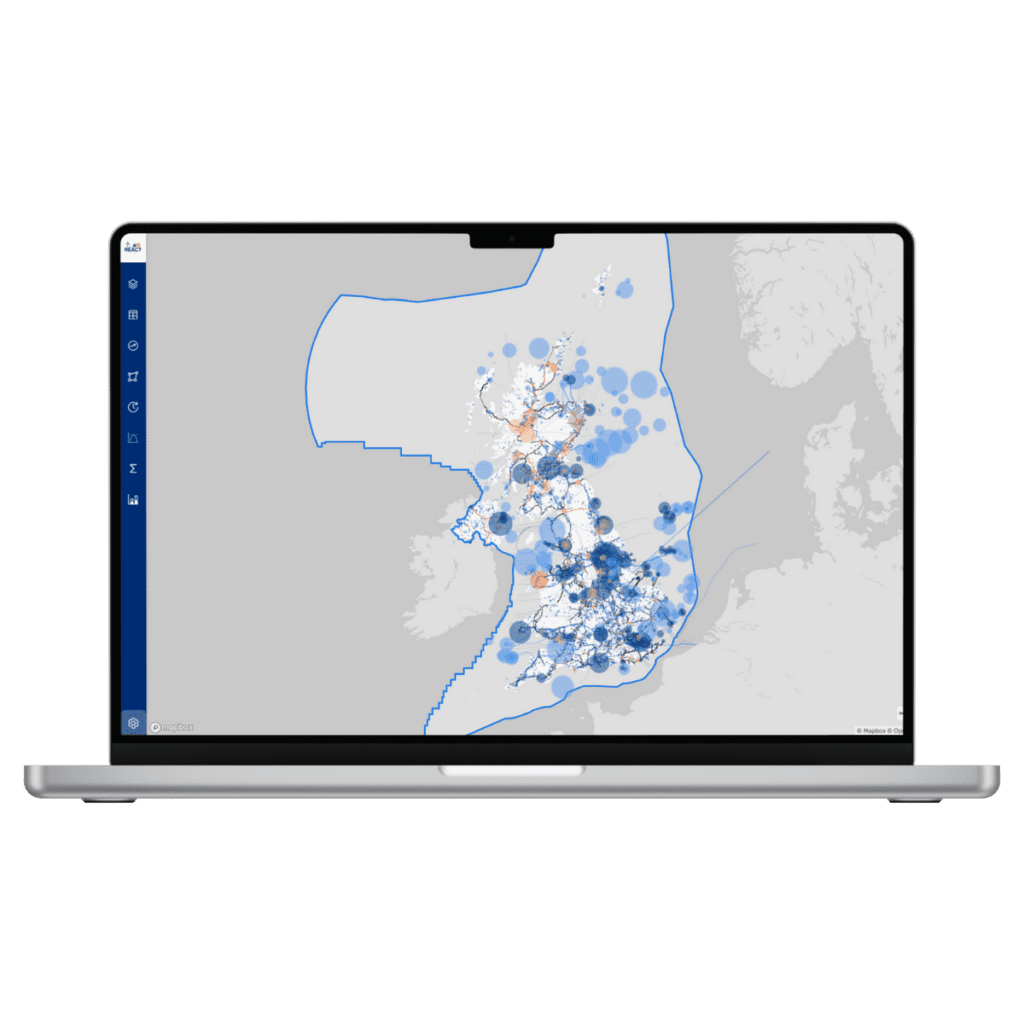
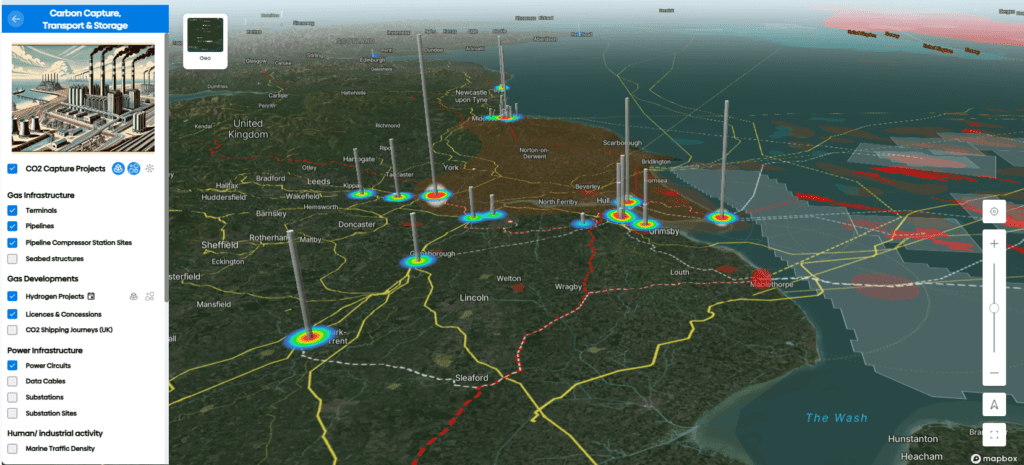
I promptly built some of these into our app and now have a result that looks ‘a bit more like geography’. For me those styling tips were transformational – as a result we have developed something that better describes the natural world, industrial & residential areas and logistics hubs / routes in a way that is useful for understanding where energy projects are needed/ can be sited, and how to move energy around.
I’ve included some choice screenshots below that highlight the fruits of my recent geography lessons. Our public preview app available at www.olsightseye.com – so feel free to mark my geography homework!
Happy Earth Day.
Exploring the Geography of Energy Systems with the Olsights Eye


