Nuclear power is back in the news again this week, but not for the right reasons.
Britain has been producing (mostly-)safe low-carbon nuclear power into the grid continuously since the commercial operation of Calder Hall at Windscale in 1959 (over 60 years ago), and nuclear energy has been increasingly featured recently in energy policy & security debates.
I wanted to understand more about the shape of the UK’s nuclear energy history, current operation and future energy transition pathways in numbers – and so built an interactive visualisation to explore the data and help others understand it too. Here I’ll introduce how the tools works, how to access it for free and summarise some of the insights that can be gained. The video below briefly explains how the interactive dashboard pages and filters work:
Firstly though I’ll reveal how I partly owe my career choice to nuclear energy. More below.
Close to Home
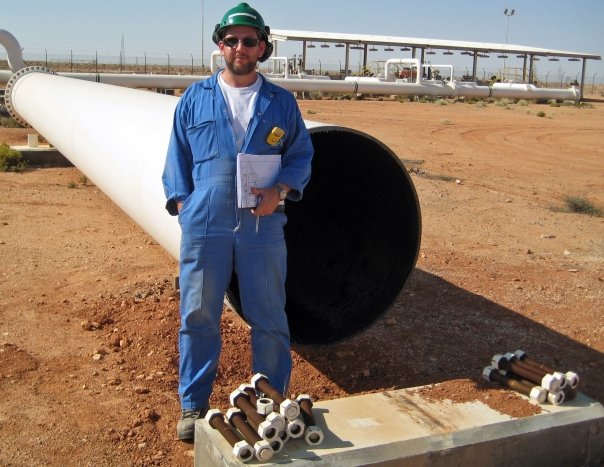
30 years ago whilst still at school in Holyhead and getting ready for A-Levels, I spent my sixth form work experience at the local Wylfa Nuclear Power Station (Anglesey). My memories of those two weeks were of analysing hydrogen quality (can’t remember what the hydrogen was doing in there?), playing with dry ice (the primary coolant was CO2 so there was lots of it on site), and getting as much free PPE and lunch as I could lay my hands on.. These were good times when people on the island had well-paid high-quality jobs, and everyone knew someone who worked at the plant. It had become part of the fabric of the island.
During the course of those weeks I interacted with various people who worked different roles at the plant, and I recall a chemical engineer I shadowed for a bit and she showed me how to change the ionic filters for the demin. water plant. She explained to me that of the different types of engineering disciplines, chemical engineers had the most interesting work and got paid the most. So I think that then was largely responsible for my course selection, and ultimately the career I followed.
Current Debate
Fast forward 30 years, and after a wide-ranging energy career built on oil & gas developments I am seeing that nuclear energy is featuring more heavily in energy policy & security debates – as government and industry gets more serious about transitioning away from fossil fuels. This is mainly due to nuclear’s unique low carbon and dispatchable/ high capacity characteristics, and its ability to produce home-grown energy (not requiring imports).
As explained in a bit more detail in my blog post on the Morlais tidal development, one of the government’s key decarbonisation objectives over the coming years is to clean up the carbon intensity of the electricity we consume. Nuclear is quoted by IPCC 2014 figures as having a median lifecycle (project construction + operational) carbon intensity of only 12g CO2/kWh, within a range of 3.7g minimum – 110g maximum depending on the project characteristics. For info the median carbon intensity of a range of other power generation sources can be summarised as:
- Coal = 820g CO2/kWh
- Natural Gas = 490g CO2/kWh
- Biomass (dedicated) = 230g CO2/kWh
- Solar PV (utility) = 48g CO2/kWh
- Hydro Power = 24g CO2/kWh
- Ocean Power = 17g CO2/kWh
- Nuclear = 12g CO2/kWh
- Wind (Offshore) = 12g CO2/kWh
It is not simple to find blends that meet future targets – so we created a simple interactive calculator [free login required] to predict the carbon emission intensity of the UK power grid as the blend of generation sources changes. Using this tool shows that an almost complete elimination of fossil fuels is required to achieve the targets, and that large-scale adoption of renewables and expansion of nuclear is required. One of the challenges with wind and solar power is it’s seasonal and somewhat unpredictable. Nuclear and carbon capture (of natural gas or blue hydrogen) are dispatchable – but both have very high investment costs.
Recent news of nuclear plant closures in UK – with Hunterston B in north Ayrshire already having closed earlier this year, Dungeness B in Kent closing last year and Hinkley Point B in Somerset due to finish later in 2022 , reports of new nuclear cost overruns at Hinkley Point C, and the potential for creating hundreds or thousands of high quality career prospects in rural communities are also important factors in fuelling the debate on how much nuclear capacity should be built into a modern low carbon electric grid. The UK Climate Change Committee (CCC)’s Sixth Carbon budget assumes a modest amount of nuclear capacity in the path to net zero by 2050. But proponents argue that more should be done – and decisions made quicker, considering that the typical timeline from concept to startup is in the region of 10 years.
Visualising Nuclear Capacity & Output
The data on nuclear energy capacity and output is openly available, but making sense of it isn’t always easy- and there don’t seem to be tools to filter and interact with this data in a fully natural way. The visualisation we built aims to help understand what the past and present looks like for UK nuclear capacity + operational output, and what the future may look like.
This Power BI visualisation can be accessed for free at our platform page www.insyn.co.uk/olwgnuclearpowerbi (login required), and some screenshots below give an idea of the interactive nature and region / status etc filters available:


Insights
A number of insights can be drawn from these visuals which I’ll summarise here:
Past + Current Capacity: UK’s nuclear capacity peaked in the 1990s and 2000s at around 12 GW. In the last 10-15 years it has declined to the current level of 6.8 GW, and will decline further to ~6 GW as Hinkley Point B closes later in 2022.
Two additional plant closures (Hartlepool and Heysham A) expected in 2024 will further reduce capacity to below 4 GW until new capacity comes online.

UK’s Past & Current Nuclear Capacity
New Capacity: The expected startup of Hinkley Point C (which is currently in construction) in 2025/2026 will add over 3GW of dispatchable power, and restore nuclear capacity to around 7 GW.
If the Sizewell C and Bradwell B plants (currently in advanced development) are sanctioned for project execution in the coming years, then a long-term restoration of nuclear capacity to 9-10GW is guaranteed. In the case that either or both of these developments stall or are cancelled then capacity could dwindle to singular plant output from Hinkley Point C only by the mid 2030s.

UK’s Current & Expected Future Nuclear Capacity
Other than these plants in advanced development, there are exciting opportunities for new next generation nuclear capacity to be created at Wylfa Newydd (Anglesey), Moorside (Cumbria) or Oldbury (Gloucestershire) – which could push nuclear capacity to 12 GW or even 15 GW. Wylfa is often quoted as being “the best site in the UK for a new nuclear plant”, and a recent trip by the UK Prime Minister to visit the Wylfa site suggests there is political support for new nuclear to come to Anglesey. In addition, options for Small Modular Reactors (SMRs) could offer a more flexible and risk-managed approach to nuclear capacity expansion.
Fit with Net Zero Policy: The Sixth Carbon Budget (‘CB6’) released in 2020 shows a limited nuclear demand of only 5 GW in three of its scenarios (Tailwinds, Widespread Engagement and Widespread Innovation) to achieve net zero by 2050, and is only increased to 10 GW in its Balanced Net Zero and Headwinds scenarios.
This suggests that completion of the two plants currently in advanced development would satisfy the demands of all CB6 scenarios. However the recent energy security fears and high costs for importing LNG from overseas to fuel gas-fired power stations as experienced so far in 2022, should mean an increased appetite to accelerate further nuclear developments such as Wylfa Newydd.
Plant Capacity Trend: The capacity of the plants have got bigger over time as the technology has matured, with first generation plants generally less than 0.5 GW, second generation plants typically in the region 1GW, and the next generation around 3GW. This evolution can be seem most clearly when overlaying the staged Sizewell A,B,C and Hinkley Point A,B,C directly against each other in either power distribution or project maturation views, like:


In Summary: In 2022, accelerating good nuclear projects (in a risk-managed way) makes more sense than ever before – and has become more urgent than ever – as the impact of rising CO2 levels are felt, global gas prices continue to escalate, the power grid becomes more challenging to balance with intermittent renewables, and the need for high-quality jobs in rural areas continues.
Our tools helps organisations to understand capacity data and explore scenarios in a way designed to accelerate good decisions – sign up today at www.insyn.co.uk


