Organisational decision-making is difficult. Decarbonisation & Energy Security Policies lay out the future ambitions of many countries to achieve net zero, however progress can be slow if using traditional working practices.
I’ve observed the following challenges in maturing energy transition projects:
- Screening (for do-ability, lifecycle economics, carbon impact) + integrating energy developments can be hard, and may require considerable resources. (more resources may not help though).
- The decision-making effort is largely a human/ organisational work problem, not a technical one.
- The technical details can be confusing to decision-makers, and the essential factors can get drowned in unnecessary detail. Vested interests may take advantage of this, and promote inappropriate pathways.
- It keeps changing! Energy transition is an increasingly dynamic problem.
Last year we built a web-based toolkit to help organisations interact with + analyse public data on the UK’s CO2 emissions, carbon capture initiation and transmission infrastructure. We wanted to answer these questions:
- Can spatial planning scenarios be examined in a visual, interactive & accessible way?
- How can decision-makers take quicker action for development pathways that meet their (and their stakeholders’) particular objectives?
- How can the supply chain access these insights and plan for the future?
As we prepare some of these web tools for a public preview, I want to share 10 insights we drew from the UK-based work – and promote a global data visualisation-driven approach that could be useful to accelerating good decision-making for decarbonisation developments.
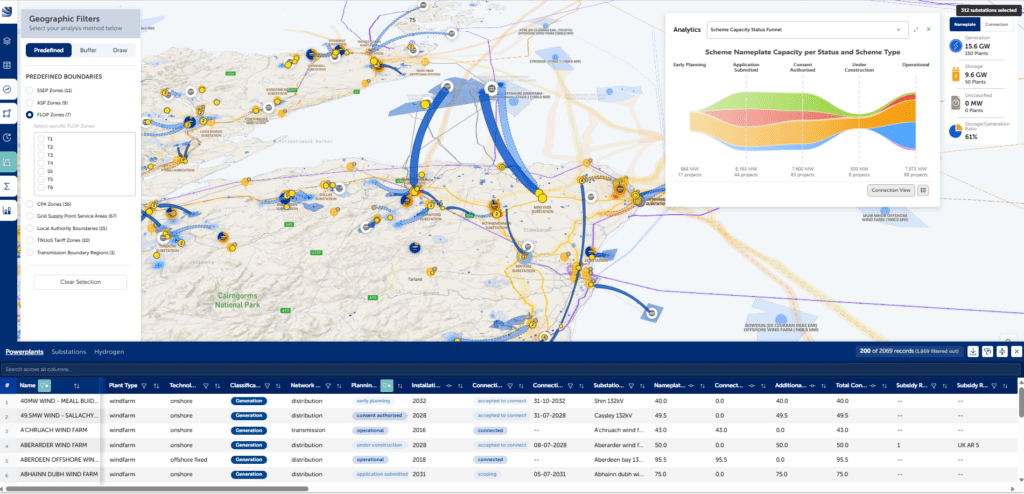
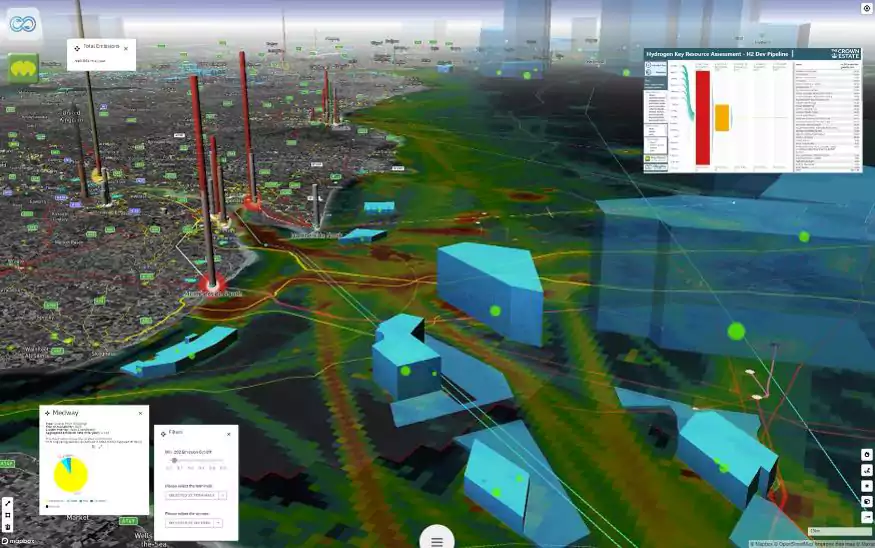
The UK’s CO2 emissions, transmission pipelines, carbon storage licences and potential shipping routes (screenshot from the soon to be released Olsights Eye)
1 – CO2 Point Emission Rates
UK point source carbon emission data can be extracted from from the public National Atmospheric Emissions Inventory (NAEI) large point sources database which compiles over 1500 individual emission sources. With some minor manipulation, the annual CO2 rates can be analysed and mapped. This database tells us that in 2020, the UK:
- Released 116 million tonnes CO2 from flues, chimneys, flares etc. This represents just under a third of the total CO2 emissions (which in the main come from home gas boilers and cars/ trucks etc).
- Released 46 M te/yr from power generation plants, which were the greatest contributing sector.
- Released 12 M te/yr from steel production, and 10 M te/yr each from refining and hydrocarbon production operations.
- Released over 15 M te/yr from the following top five emitting sites:
- RWE Pembroke Power Station (3.8 M te/yr, South Wales)
- VPI Immingham Power Plant (3.2 M te/yr, Humberside)
- Tata Steel Port Talbot Power Station (2.9 M te/yr, South Wales)
- South Humber Bank Power Station (2.8 M te/yr, Humberside)
- Saltend Power Station (2.7 M te/yr, Humberside)
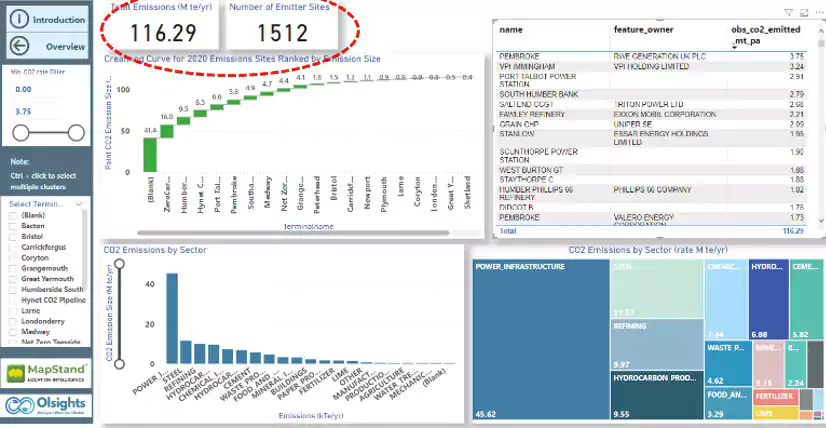
An interactive dashboard created by Olsights to explore UK national CO2 emissions.
2 – CO2 Emissions Quality + Capture Cost
Not all CO2 emissions are equal – at least not in the sense of the ease of capture, operational energy demand, and associated capture costs. The ease + cost of capture from an emission stream is related to the ‘partial pressure’ of the CO2 – which is defined by the emission’s absolute pressure multiplied by its concentration % of CO2. This leads to the following conclusions:
- Capturing CO2 from a pressurised process gas stream and/or a concentrated flue will be the easiest and lowest cost process.
- Capturing CO2 from an atmospheric and/or a dilute flue will be the most challenging and highest cost process.
- Capturing CO2 from the air will be the most difficult, energy hungry and costly process of all, as it has the lowest pressure and most dilute concentration of CO2 compared to any emission source.
The Global CCS Institute’s “Technology Readiness and Costs of CCS” report is a useful resource that describes these effects in more detail with supporting charts. Section 8 of that report summarises typical partial pressures and unit capture costs for the most common plants which include:
- Some steel processes at 26 – 35 kPaa ($45-50/te CO2)
- Cement kiln at 18 kPaa ($50-65/te CO2)
- Coal power at 14 kPaa ($52-75/te CO2)
- Biomass power at 12 kPaa ($55-80/te CO2)
- Natural Gas Combined Cycle at 4 kPaa ($75-125/te CO2)
- Some steel processes at 2 – 4 kPaa ($75-180/te CO2)
- Aluminium smelting at 1 kPaa ($180-300/te CO2)
Another implication is that the partial pressure limits the maximum individual capture plant size: A coal power plant has a maximum capture plant size of 1.5 M te/yr CO2, whilst for gas combined cycle this is reduced to 0.66 M te/yr CO2 – therefore requiring multiple plants for the same carbon removal.
The implication here is that tackling those emissions with a higher partial pressure represent the best use of capital and energy resources and should be prioritised.
3 – CCS Clustering & Shipping Opportunity
In our analysis we considered CO2 emission ‘clusters’ to be located only at coastal evacuation points (for offshore storage) where an existing emission in the range ~1 M te/yr CO2 was present. A nominal 30km reach to evacuate inland emissons was assumed, and this also included a 30km buffer around the Track 1 CO2 pipelines as defined in consultation documents.
In this way, 20 coastal exit points were considered:
- 8 x pipeline terminals
- 12 x shipping terminals
The south of England, South Wales and Northern Ireland are generally >100km from the Track 1 clusters / pipeline terminals. However these 12 shipping terminal exit points account for ~30 M te CO2/yr of existing emissions (from power, steel, refining).
Shipping of CO2 offers flexible and lower cost project opportunities to get many coastal CO2 volumes away to stores, in a way that could proceed individually without dependence on multi-participant pipeline developments. Conceptually, CO2 from numerous coastal shipping exit points could be either:
- Aggregated at pipeline terminal jetty facilities (such as Humberside, Peterhead) OR
- Aggregated offshore at injection loading buoys
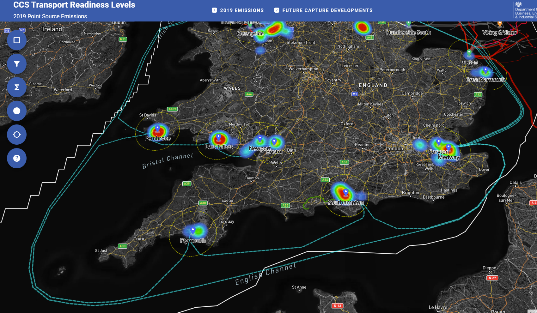
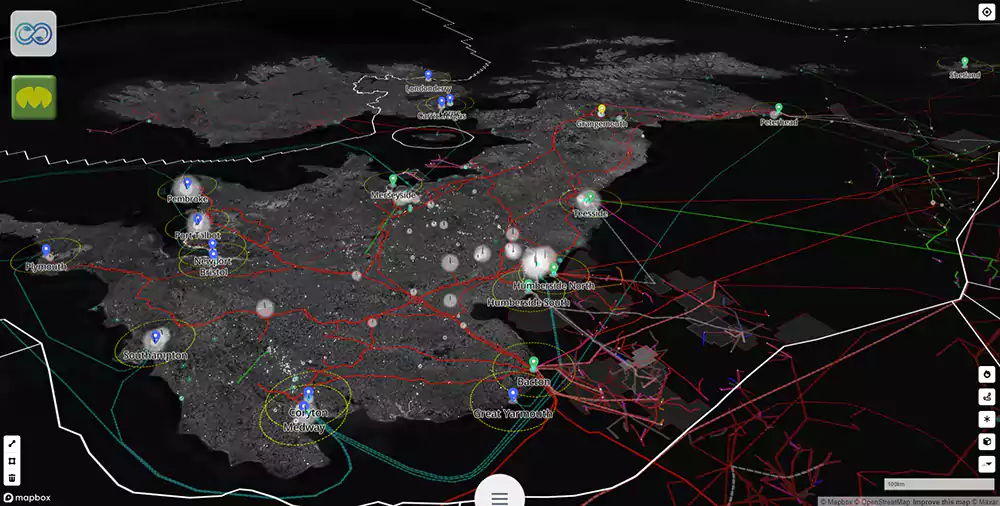
A map showing coastal CO2 exits, with potential shipping routes from the south of England and Wales (screenshot from the soon to be released Olsights Eye)
4 – Dispersed CO2 Emissions
There are some large inland CO2 emissions that can be considered ‘dispersed’ (outside of reach of the coastal cluster points). The top 15 dispersed sites account for an additional 13 M te/yr CO2 above the coastal cluster totals. These are mainly from the power + cement sectors.
The best opportunities for gathering large dispersed volumes to exit points include: Staythorpe C, Didcot B, Spalding and Carrington power stations. From these locations, pipelines could offer efficienct transportation on account of the larger capture volumes / economy of scale.
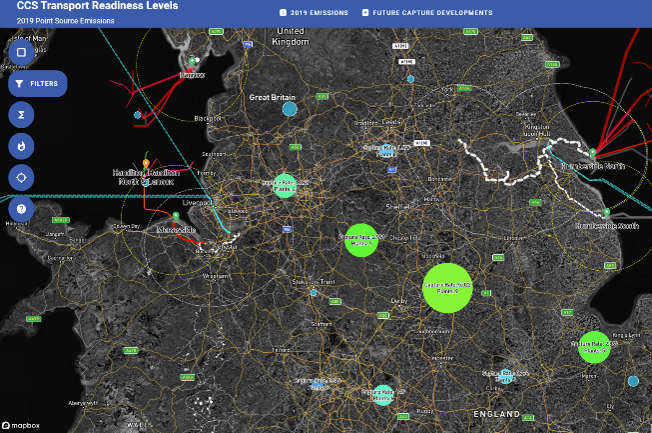
A map showing dispersed large CO2 emissions, with proximity to coastal exit infrastructure (screenshot from the soon to be released Olsights Eye)
5 – CO2 Capture Developments
Our inventory of known UK carbon capture projects included 56 developments, of which 21 of these were capturing from power plants and 17 were from blue hydrogen.
The total CO2 capture development capacity is 62 Mte/yr, of which 25 Mte/yr each comes from power plants and blue hydrogen.
The regional breakdown can be summarised as:
- England: 40 capture plants @ 46 Mte/yr
- Wales: 8 capture plants @ 10 Mte/yr
- Scotland: 7 capture plants @ 6 Mte/yr
The single largest capture project is at the Drax biomass power station (Humberside) which if fully scaled will remove 8 Mte/yr.
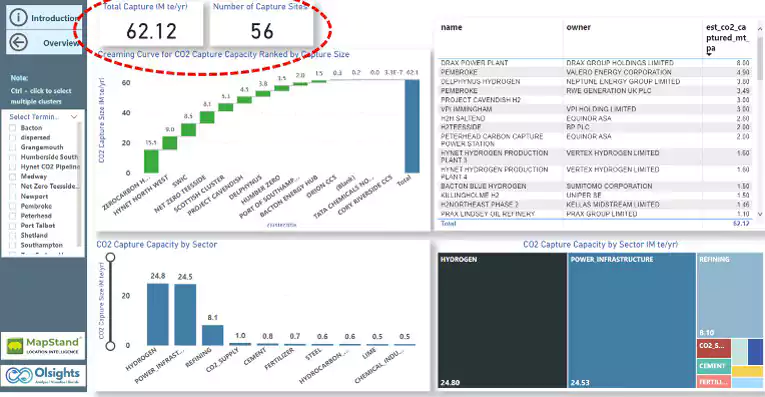
An interactive dashboard created by Olsights to explore UK national CO2 capture developments
6 – CCS Capture Development Maturation
Of the 56 known UK carbon capture developments (capacity 62 Mte/yr), only ~11 M te/yr of capacity has progressed to FEED/ project planning. The remaining ~51 M te/yr can be described for now as concept studies.
Experience shows that only a portion of concept studies progress to FEED, and only a portion of FEED / project planning studies progress to FID. However as decarbonisation projects pick up pace, and the first CCS projects achieve FID then move into project delivery, it is expected that new concept and FEED studies will enter the maturation funnel.
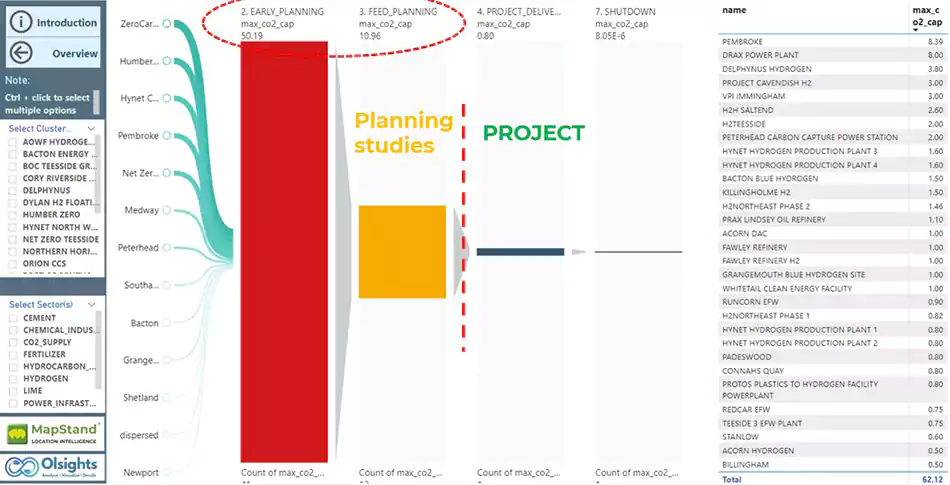
A carbon capture development maturation funnel dashboard created by Olsights
7 – Link between Blue Hydrogen and CCS
For a range of blue hydrogen plants, there should be a close correlation between the hydrogen production capacity and the carbon capture capacity, depending on the hydrogen reforming + carbon capture technologies used.
We made best efforts to correlate these two capacities for each of the 17 blue hydrogen plants based on published project data and cluster totals. Where a hydrogen capacity was known, but carbon capture omitted – or vice versa – the correlation made approximate estimates for the missing quantity possible.
It should be noted that the CO2 associated with blue hydrogen is ‘new’ / future CO2, and in the event that these projects do not proceed they may significantly reduce the amount of CO2 captured for offshore storage. This risk increases when use cases for the hydrogen included speculative destinations such as home heating (which is not supported by evidence).
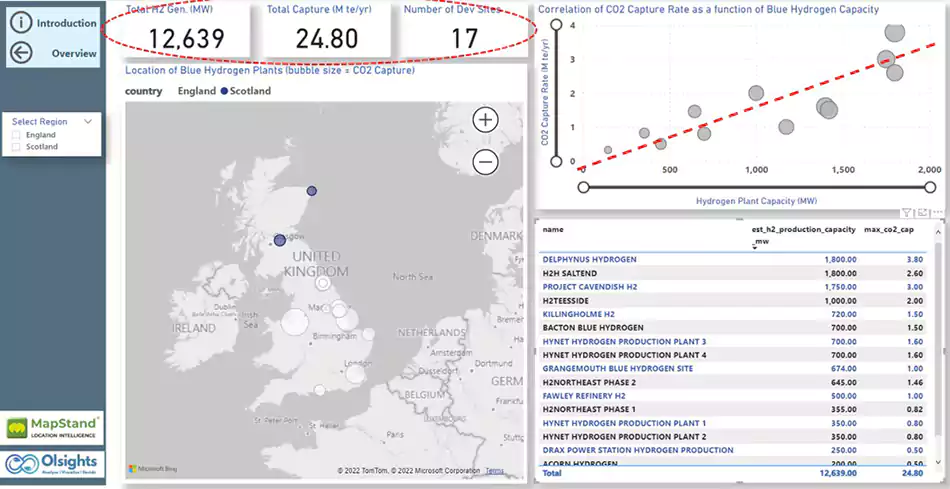
A correlation between blue hydrogen and carbon capture capacities dashboard created by Olsights
8 – National Net Zero Policy
In the UK, the Climate Change Committee (CCC) sixth carbon budget (‘CB6’) Methodology Report describes the latest methodology, assumptions, scenario pathways and results of the CCS demand requirements for the UK to achieve net zero by 2050. Many of the CB6 methodology, assumptions, scenario pathways etc are further described in the Element Energy report Deep Decarbonisation Pathways for UK Industry, which underpins the CCC reports.
Five different net zero scenarios were considered by this body of work, and the data allows the CO2 capture demand per scenario, sector and region to be viewed. Analysis of this data gives the following insights:
- By 2030, CB6 shows that CO2 capture of 13 – 26 M te/yr is required to meet net zero by 2050 – depending on scenario
- In general the demand for carbon capture increases sharply from 2030 to 2040, then continues a modest rise from 2040 to 2050.
- By 2050, CB6 shows that CO2 capture of 72 – 180 M te/yr is required to meet net zero – depending on scenario
- Carbon capture is generally dominated by electricity supply sector in 2030, however by 2040 and beyond the carbon ‘removals’ category (Bioenergy with CCS, and/or Direct Air Capture) dominates other sources of captured carbon.
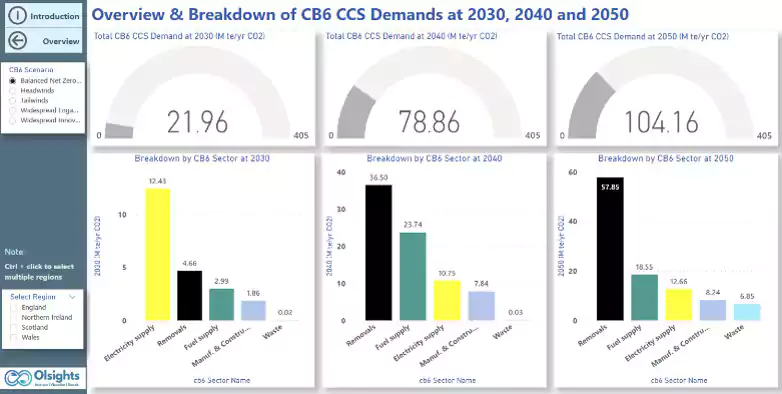
Sixth carbon budget (CB6) CCS Demand to 2050 Dashboard created by Olsights
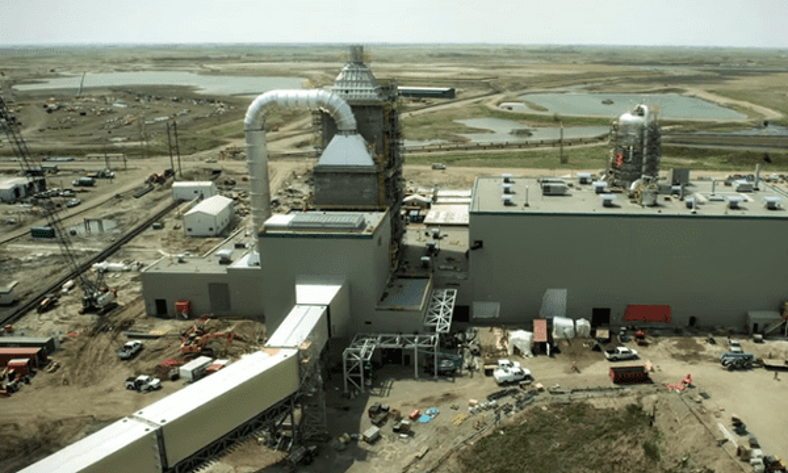
9 – The Scale is Massive
When looking at aggregated large numbers of CO2 emissions or capture projects, it is sometimes easy to forget the enormous scale of these developments both individually and collectively.
The photos below give an idea for capture plants to remove CO2 from coal-fired power stations. In cases for other sectors where the partial pressure of the CO2 is lower [see Point #2 above] such as biomass or gas-fired power stations, the maximum plant size is reduced – and more large plants are required to achieve the same CO2 removal.
Petra Nova pulverised coal (USA):
- 1.4 M te/yr CO2 capture for enhanced oil recovery
- Cost ~$1bn; operational in 2017
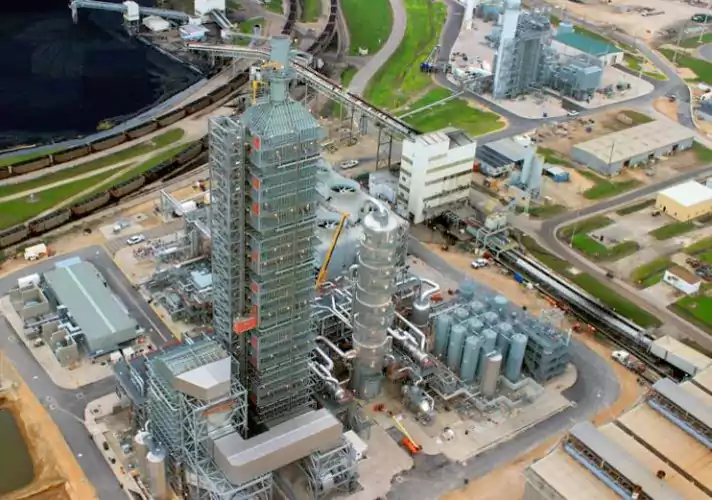
Petra Nova coal CCS
Boundary Dam pulverised coal (Canada):
- 1.0 M te/yr CO2 capture for enhanced oil recovery
- Cost ~$1.5bn; operational in 2016
Boundary Dam coal CCS
Many carbon capture plants have a poor operational performance record, and the large scale of these plants make them more difficult to rectify once projects are completed. Other challenges introduced by the scale of these projects include:
- Supply chain limitations / restrictions (especially with a global demand)
- Availability of project personnel
- Project cost / duration overruns after FID (may be a symptom of above factors).
10 – It Keeps Changing!
We observed all the way through our analysis that not a month goes by where any combination of new project initiation, development status, capture capacity, partnership etc changes. It is a fast-evolving and emerging scene that requires regular maintenance of datasets. Some examples seen through 2022 include:
- The CF Fertilizer plant at Ince whose captured carbon was one of two initial feeds for the Hynet CO2 pipeline. It then suddenly and permanently closed in summer 2022 following the rise in fuel gas prices.
- The destination for the Medway / Project Cavendish captured CO2, which gets reported variously over different months as Peterhead, Merseyside, Humberside etc.
Conclusion
The current inventory of maturing carbon capture developments (at capacity 62 M te/yr CO2 by 2030) seems to compare quite well with existing point source CO2 emissions (116 M te/yr CO2 at 2020), and net zero policy scenarios (at capacity 72 – 180 M te/yr CO2 by 2050). However not all CO2 is the same – and the partial pressure of the CO2 can have a big impact on capture project size, energy consumption and cost.
Much of the ‘new’ 25 Mte/yr CO2 from blue hydrogen may be speculative, but the opportunity to capture 30-40 Mte/yr CO2 from ‘shipping terminals’ + large dispersed sites is real – and may offer some interesting routes to acceleration.
This post is intended to demonstrate a visual data-driven method that allows organisational units and individual managers, analysts, researchers or engineers etc to quickly explore and extract their own insights from a common web application.
A top-level management dashboard created by Olsights for CO2 emissions and CCS capacity
We created these visuals through 2022 to help make sense of the evolving UK CCS scene through the support and sponsorship of The Crown Estate and together with our data partner MapStand. As a result we have developed a unique visual data platform for examining scenarios that i) can keep up with the pace of industrial change coming, and ii) is agile in creating custom visuals to solve different regional / global or sector decarbonisaton project problems.
This post focused mainly on our CCS analytic dashboard and resulting insights, and we are planning to release the public preview of our global geospatial visualisation product ‘Olsights Eye’ (using the same datasets) in the coming weeks. Please keep a look out for this release!
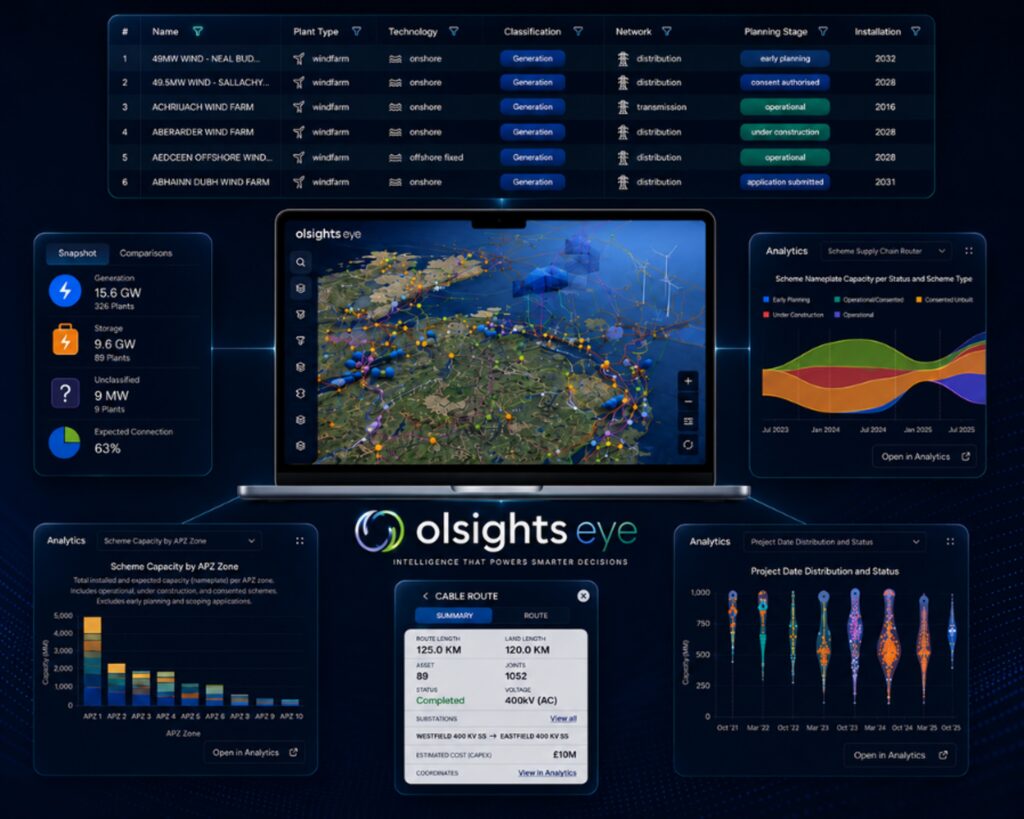
The Olsights Eye integrated energy map (public preview released mid Jan 2023)
Contact us at hello@olsights.com to subscribe to our existing UK analytic dashboards, create custom global versions of these, or to keep up to date with the preview of our Olsights Eye global map application.