The first thing to say, I am not an economist; in fact, I have only just started to learn about economics in my recent studies. Specifically, I have been learning about microeconomics. Microeconomics is a branch of economics that studies individuals and firms’ behaviour in making decisions regarding the allocation of scarce resources and the interactions among these individuals and firms. Despite my inexperience (and ineptitude), I have learned a few things about microeconomics that inform our understanding of the energy transition, and people might find this interesting.
Supply and Demand
The foundation of microeconomics is the supply and demand curve for goods (figure 1). The demand curve is perhaps the easiest to understand. As the price falls, the demand increases until the point at which market demand is saturated. Generally, the cheaper something is, the more people buy.
The supply curve is perhaps a little less intuitive. The supply curve shows the increase in cost for producing more units, or the quantity that firms are willing to supply at each price. Perhaps the easiest way to understand this is the supply of oil. Oil has variable costs for extraction. Onshore oil from shallow surface wells is cheaper to extract than from offshore, deepwater and deeply penetrating wells. In this situation, the next barrel of oil supplied to the market is more expensive than the last. The marginal cost is the change in the total cost that arises when the quantity produced is incremented by one unit; that is, it is the cost of producing one more unit of a good. Intuitively, marginal cost at each level of production includes the cost of any additional inputs required to produce the next unit. Here I have shown the simple case where the demand shows a linear increase with price. As the price increases, the seller is inclined to supply more units. For our following discussion, figure 1 will suffice as generally the next barrel of oil is more costly than the last barrel of oil for the reasons explained.
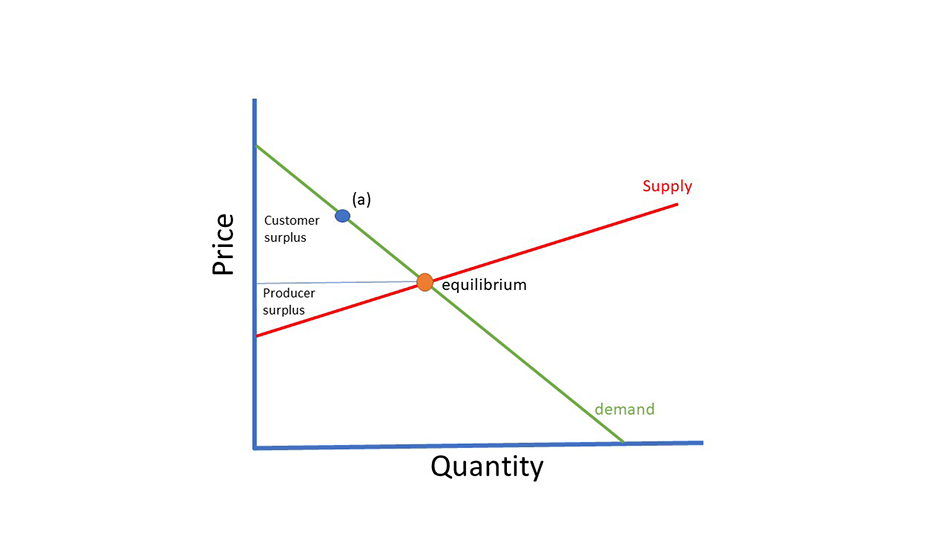
Figure 1
In a free market supply and demand will find equilibrium. Equilibrium is the state in which market supply and demand balance each other, and as a result, prices become stable. Generally, an over-supply of goods or services causes prices to go down, which results in higher demand; while an under-supply or shortage causes prices to go up resulting in less demand. At the equilibrium point, the market is efficient, balancing the needs of the supplier with the needs of the customer. This balance between supply, demand and prices is the invisible hand of the market at work, as first described by Adam Smith.
The customer surplus is the difference between what the consumer pays and what he would have been willing to pay. Consider a customer prepared to pay the price (a); then the surplus is the difference between the equilibrium price and the price the customer would be prepared to pay. It is essential to realise that different customers are ready to pay different prices in a free market. So for our barrel of oil example, some customers value oil much more than others. As prices rise, fewer customers are prepared to buy oil. The total surplus is the sum of all the customer surpluses.
The producer surplus is the converse of customer surplus. This is the difference between the price a firm receives and the price it would be willing to sell it at. As prices fall fewer firms are prepared to supply the goods. With our oil example, as oil price falls, more expensive oil is shut-in, and projects requiring a higher oil price to make a profit are put on hold. We only need to look at how the more expensive shale-oil production varies with oil price to know that this is the actual state of affairs.
Market Forces
Oil prices and oil demand rise and fall. These changes occur in the market is because supply and demand curves can shift according to market forces (Figure 2). For example, if the economy is experiencing high growth, the demand curve will shift as customers are prepared to pay more for oil, So there a demand moves the equilibrium price point. So demand curves are not constant. Another example with rising incomes, customers are prepared to pay more for goods. Demand curves can also shift downwards, for instance, during an economic downturn.
Similarly, the supply curve can also change according to market forces. We have already said that each incremental barrel of oil costs more to produce, and as a consequence, suppliers will generally not supply more oil beyond the equilibrium point. However, what if we could somehow make the overall cost of extracting oil cheaper. This shift is what has happened due to innovations in the technology for extracting oil. New inventions have reduced the overall cost of extracting oil. So the supply curve can shift with improvements in technology (figure 3). All other things being equal, this technological improvement decreases the price and increases demand.
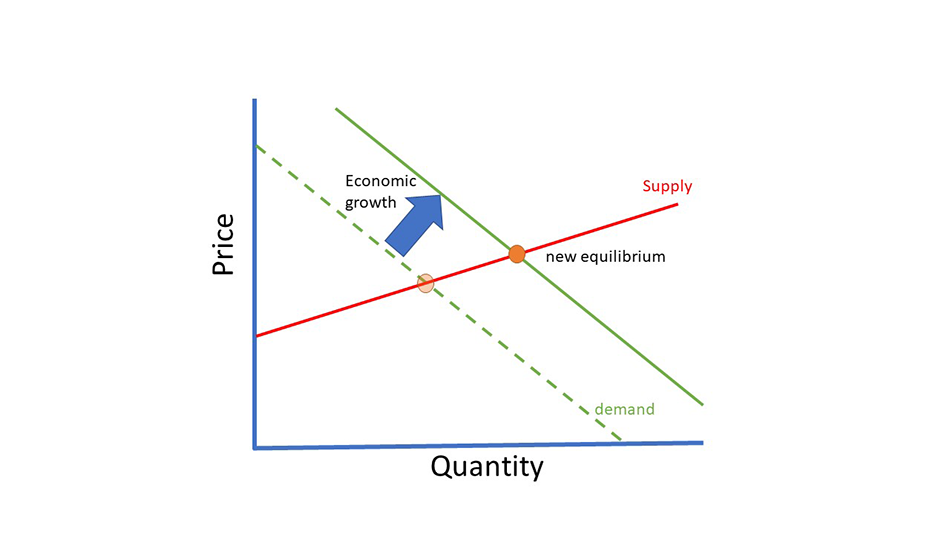
Figure 2
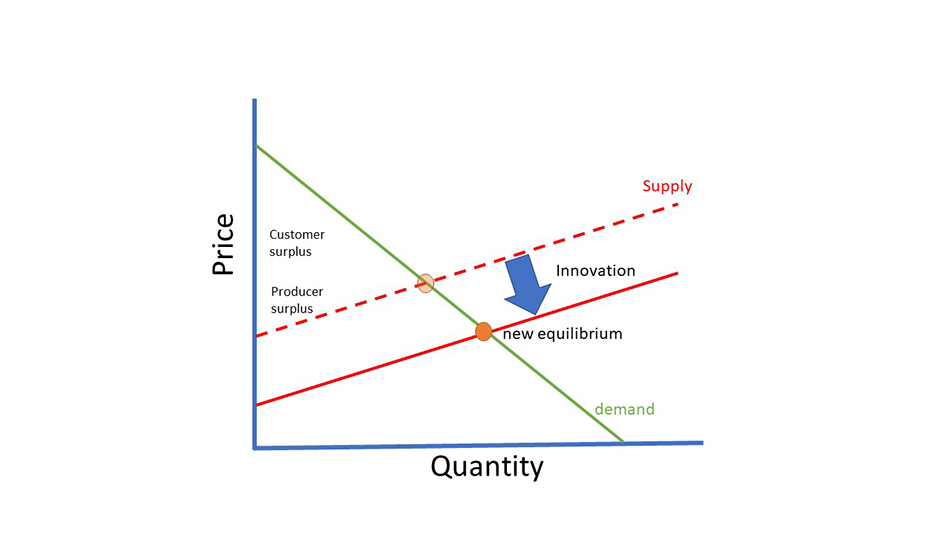
Figure 3
Externalities
So what has microeconomic theory got to do with energy transition? The answer lies in externalities. So far we have only considered the transaction between the supplier and the customer where all costs and benefits are internalised. Externalities are a consequence of an industrial or commercial activity that affects other parties without this being reflected in market prices. So, for example, if I buy gasoline for my car, I am satisfied with the transaction. However, there may be people impacted that are not an immediate party to the transaction. If I drive my car into town along a busy street, people living next to the road experience pollution and a cost to their health. People who are living next to an oil refinery may experience pollution. The impact of externalities means that the transaction’s full cost impacts are not reflected in the transaction price.
Where the market does not carry the social costs of externalities, this is considered a market failure (figure 4). The question is, who pays for the external impact of pollution from burning oil and gas? If there are negative externalities, there must also be positive externalities. Energy from oil and gas has brought enormous benefits to our wealth and health. There are many examples, plastic made from oil keeps our food fresher for longer and reduces the cost of food. The oil industry creates employment that supports jobs that are indirectly related to oil and gas via cash flowing through the economy. The fact that there are both positive and negative externalities is why there is such a polarised debate around climate change and energy transition. This polarisation is because externalities are normative and individual. Suppose I drive my car from my home in a rural area with light traffic into the town where there is heavy traffic. In that case, I experience non of the pollution that people living on my commuter route experience. Still, I receive all of the benefits of my freedom to travel to work and earn a salary. So externalities cause two types of market failure, on the one hand, a failure to realise all of the social costs, on the other hand, a failure to realise all of the social benefits.
The same market for the same good can create both negative and positive externalities depending on the individual perspective. This normative perception is precisely why we have climate change activists (Extinction Rebellion) and climate change sceptics (Friends of Science). The debate around science used by both sides is possibly a red herring; in reality, it is a (big) argument about externalities.
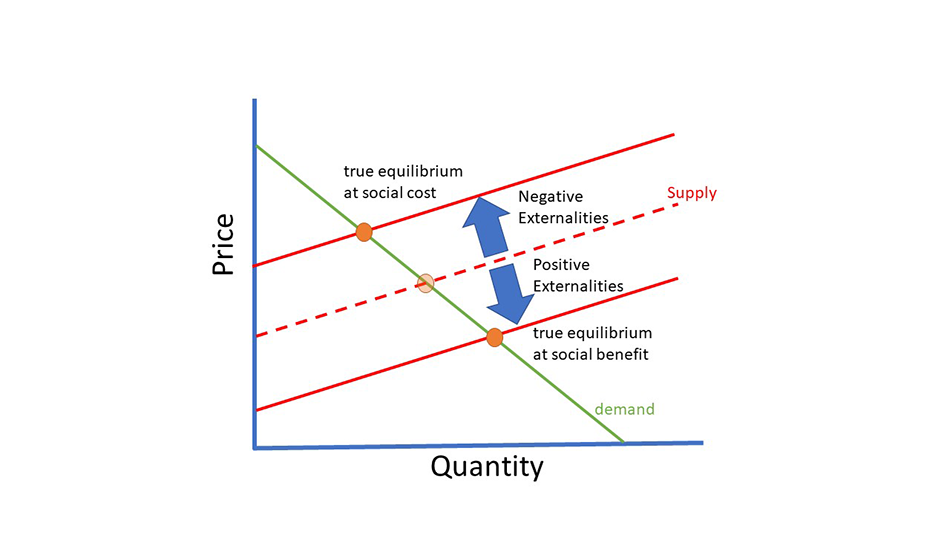
Figure 4
Global warming and climate change is considered a negative externality. This negative impact is a complicated problem because the externality is trans-generational. That is, the true social costs of global warming will not be born by this generation but by the next generation. The costs of transition will be borne by those who work in the traditional oil and gas sector as jobs disappear. This cost particularly impacts the older generation nearing retirement.
Taxes and Subsidies
Externalities create market failure, where the market price does not reflect the externalities. This is where market intervention comes into play. One of the most straightforward solutions is for government to intervene in the market by imposing a tax or subsidy. A tax shifts the supply curve and the equilibrium point to produce fewer units (figure 5). The theory is that a carbon tax incentivises a reduction in oil consumption and forces consumers to switch to other energy sources. This type of intervention is a Pigouvian tax. A Pigouvian tax is a tax on any market activity that generates negative externalities (costs not included in the market price). The tax is intended to correct an undesirable or inefficient market outcome (a market failure ), and does so by being set equal to the external marginal cost of the negative externalities.
Conversely, where the full social benefits are not realised, the government can impose a Pigouvian subsidy. A Pigouvian subsidy is a subsidy provided to an activity on the grounds (i.e., with the explicit rationale) that the activity generates external benefits (i.e., positive externalities). Energy policy makes use of both Pigouvian taxes and subsidies. On the one hand, a carbon tax, or carbon pricing. On the other hand, market subsidies for things like solar such as an enhanced guaranteed feed-in-tariff.
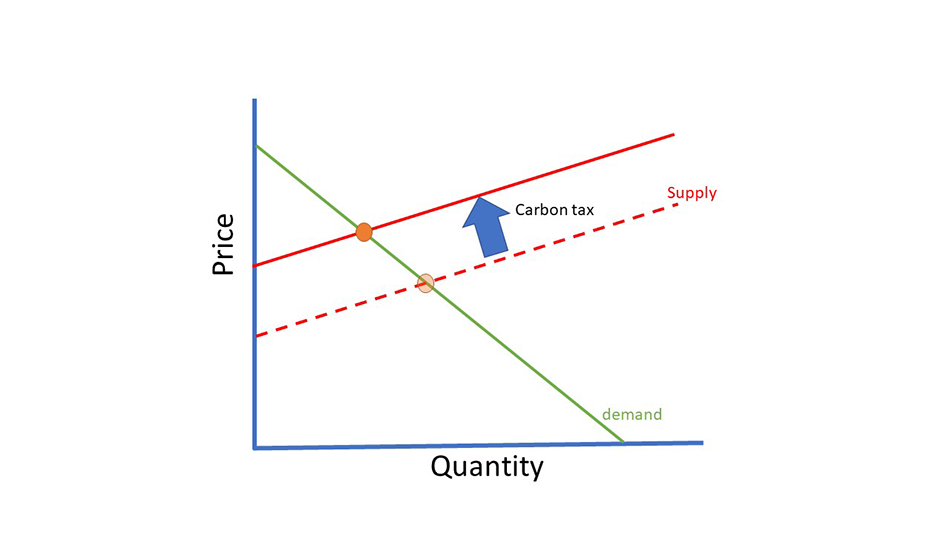
Figure 5

The Curious Case of Hydrogen
Hydrogen is such a hot topic, it is worthy of consideration in terms of microeconomics. Hydrogen is a potential substitute for natural gas (to heat our homes) and for petrol (to power our automobiles). For now, I am going to ignore the challenges around the efficiency of hydrogen, and the detailed economics of hydrogen. For more detail on the economics of hydrogen, refer to:
The Economics of Hydrogen (olwg.co.uk)
I will consider the market for hydrogen as an energy carrier (not as a chemical feedstock). First, we can think about the demand curve as it stands today.Currently, there is no demand for hydrogen (as an energy carrier). There are very few hydrogen cars on the road, and hydrogen for home heating is a pipe dream. So today, we would expect the demand curve to be very steep (Figure 6).
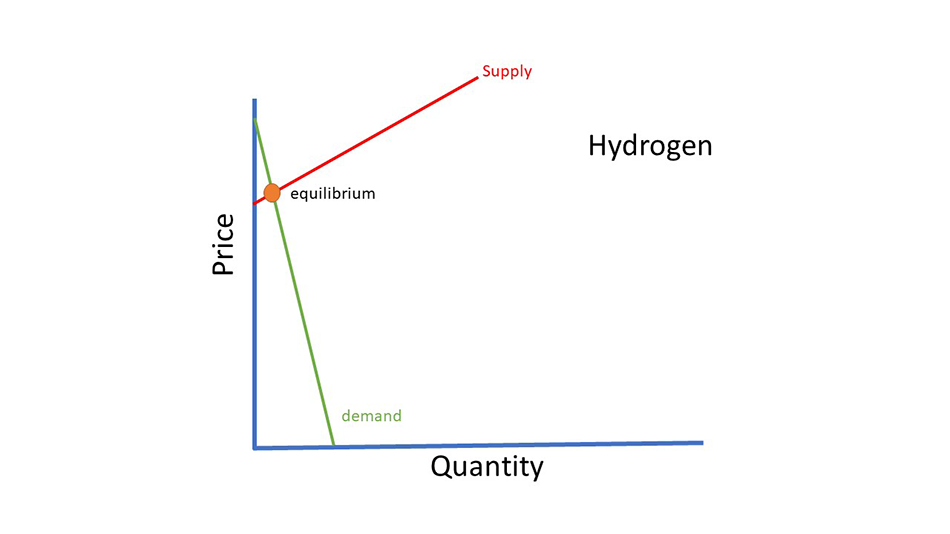
Figure 6
When a demand curve is this steep, we say that the demand is inelastic. That is to say that a price decrease will not produce a big change in demand for quantity. Hydrogen is also expensive, at least ten times more expensive than natural gas (and more like twenty times more expensive). As a consequence, without market intervention, the hydrogen market is tiny. So what can be done to increase the size of the hydrogen market? If the government likes it as a vector, the first way is to impose a subsidy (Pigouvian subsidy). This subsidy would be based on all the social benefits we perceive for hydrogen. Reduced pollution, improved health, jobs created in a new industry, etc…. (figure 7).
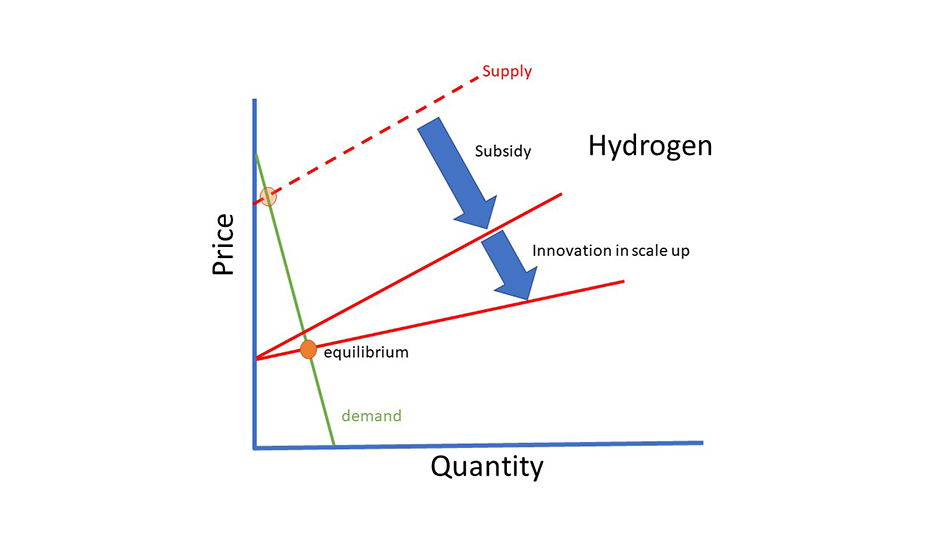
Figure 7
We could also innovate so that the scale-up of hydrogen becomes cheaper, in effect flattening the supply curve.That still leaves the problem on the inelastic demand curve (figure 8).
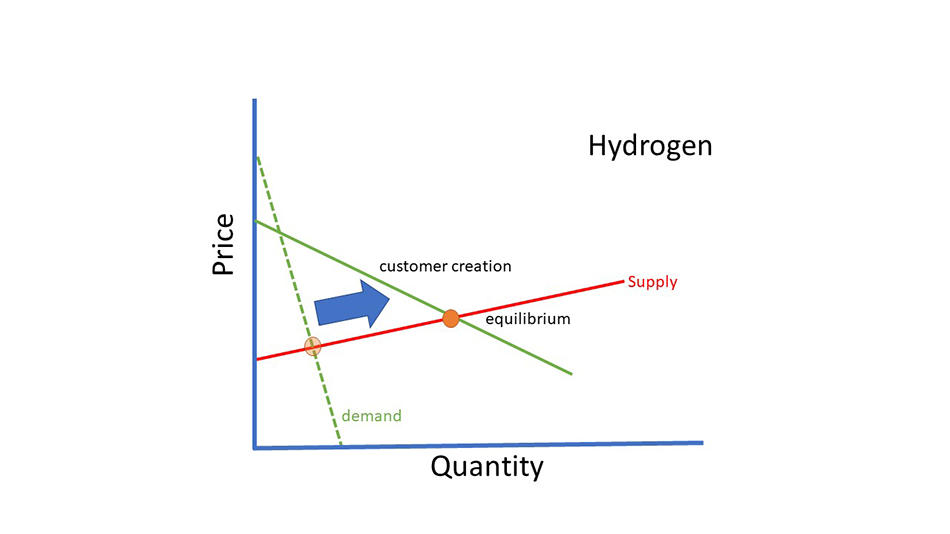
Figure 8
So there is also needs to be a stimulation of demand. Some of the demand will be stimulated due to the subsidy reducing cost, but governments are also going to have to create a customer base. This market creation is already occurring with governments implementing public transport based on hydrogen. In the UK, the government is attempting to subsidise converting the natural gas network and home heating based on natural gas to hydrogen. Demand-side stimulation is the most challenging part of moving niche technologies to main-stream, and it is the place where failure is most likely to occur.
So if we do create a hydrogen market, then what? There are a few issues to consider
- Hydrogen is not very efficient compared to other energy vectors. So there is an externality in that it will use more energy than is required to do the job using other energy carriers (figure 9). Is the negative externality of efficiency loss more or less than the positive externalities created by hydrogen properties? Hydrogen is lightweight dispatchable and convenient.
- Government subsidies are not forever. Ultimately most governments prefer the invisible hand of the market (figure 1). The question is, can the cost of hydrogen come down through market subsidy and stimulation of the market. The production of hydrogen is 75% to 85% efficient. Further losses in efficiency are in the transportation and the end-use. Hydrogen is an energy carrier, and green hydrogen is made from electricity. You cannot get out more energy than you put in. Currently, 80% of the cost of green hydrogen production is in the OPEX, and most of that is in the cost of energy. So if the subsidy is removed, will the market shrink (figure 10), or are more consumers prepared to pay more for hydrogen (figure 11).
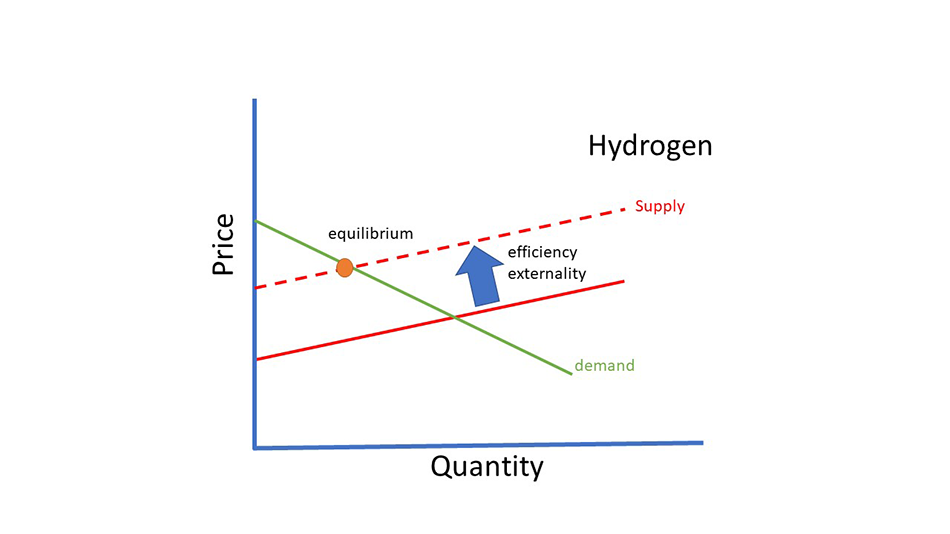
Figure 9
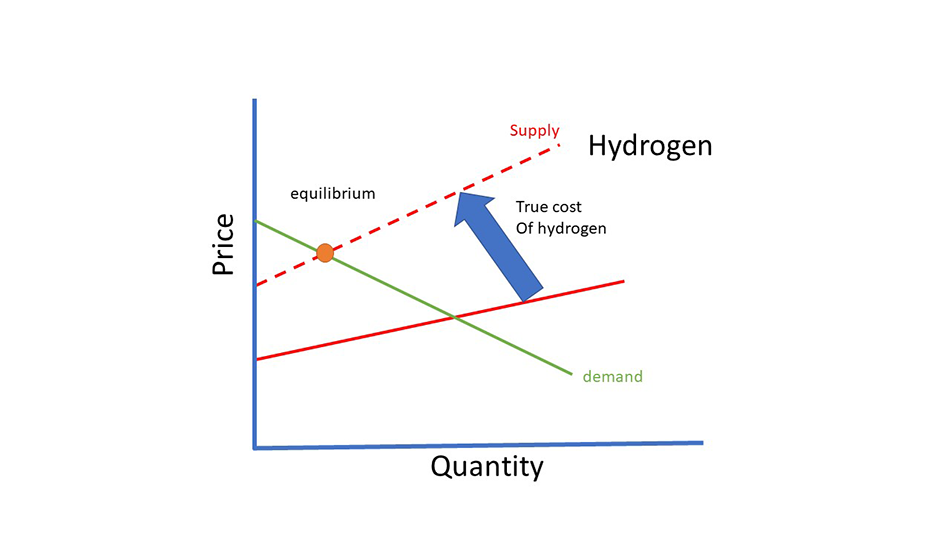
Figure 10
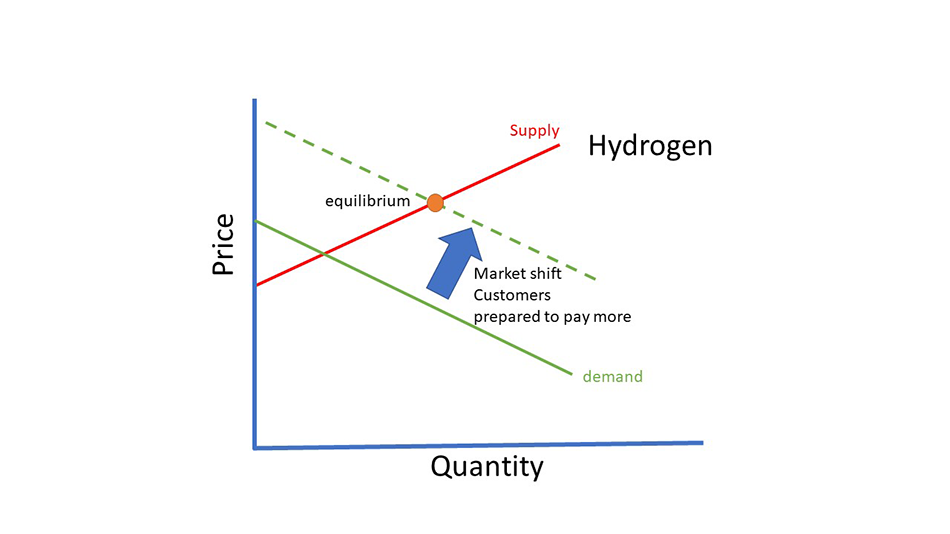
Figure 11