– A summary of Belgian Carbon Capture (CCS) & Hydrogen Developments Coming Up, and How to Find out More
One of my goals upon moving back to UK in 2009 was to see a lot more of Europe. I completely failed.. But it’s still a goal to be achieved one day, and these last few months I’ve enjoyed now three visits to Brussels to join decarbonisation innovation conferences and networking events.
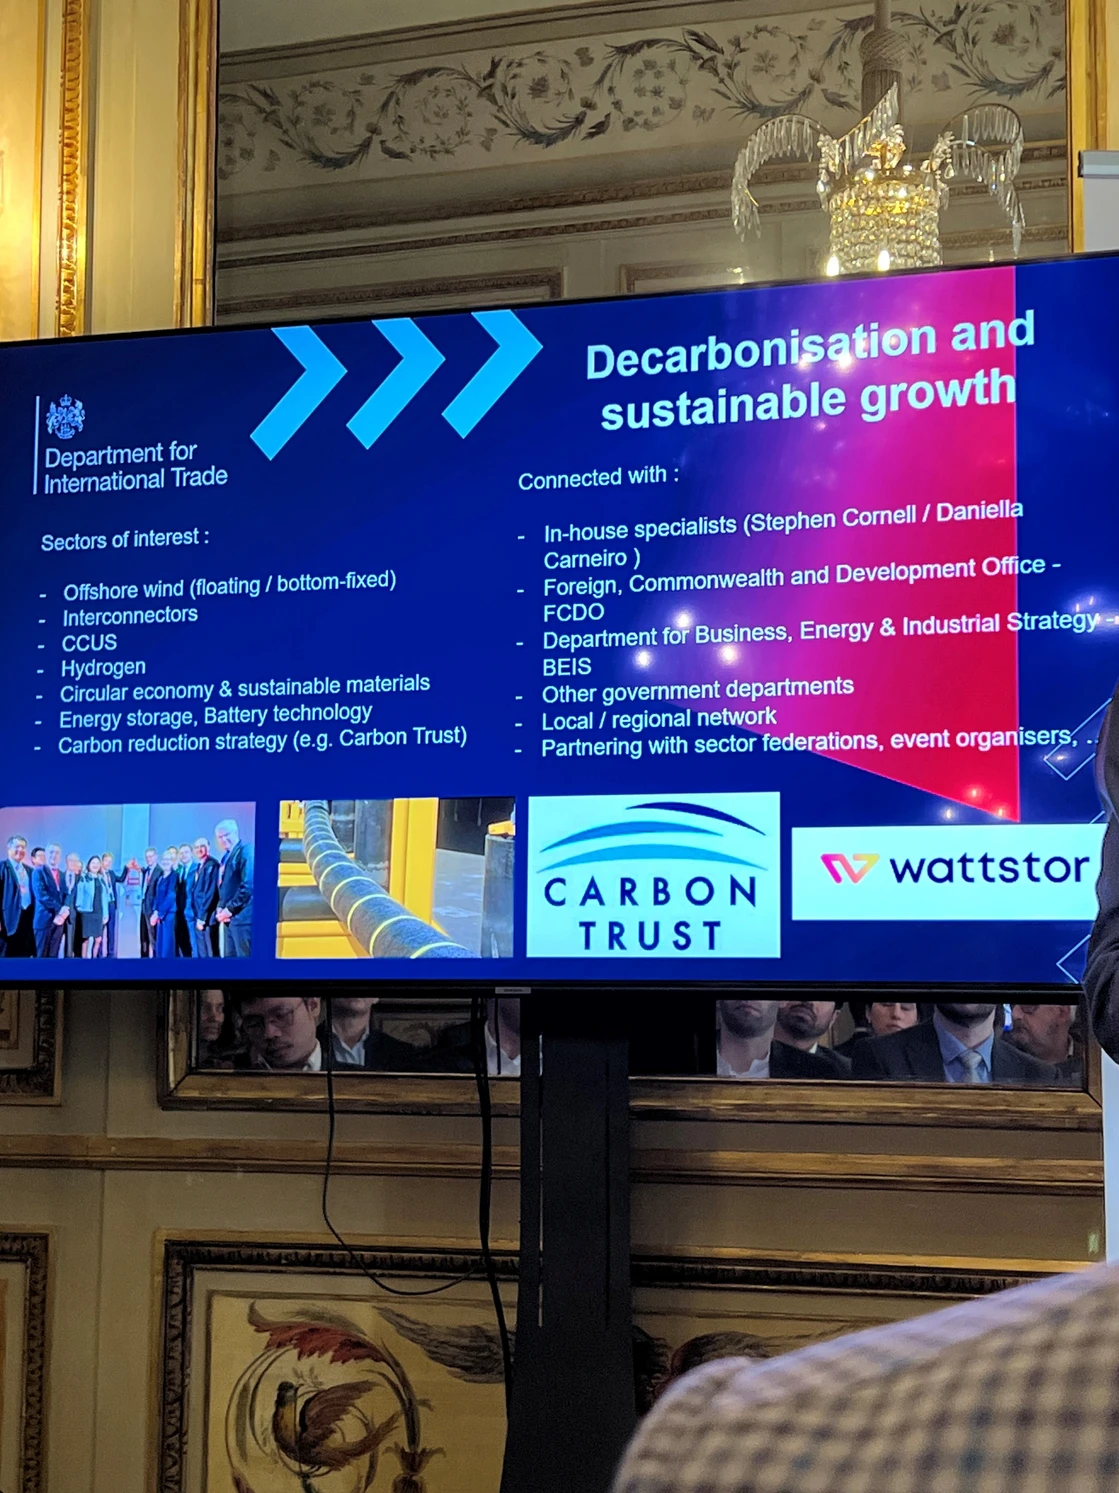
I was fortunate enough this week to be able to participate in the Belgo-British CCUS (Carbon Capture, Utilisation and Storage) Seminar organised by the trade department of the British Embassy Brussels. The Eurostar being cancelled at short notice didn’t stop me from getting over to this excellent action-packed event.

Waffle-seller in Brussels
In the context of energy security worries in Europe and an increasingly complex energy transition with an ever-changing project scene, I wanted to share some simple insights on what our tools are able to reveal about the past, present and future of carbon capture developments in Belgium which I presented during the Belgo-British CCUS Seminar. As a bonus I’ve included a summary on Belgian hydrogen developments.
CCUS Seminar
The event itself included a panel discussion and a number of sessions featuring high profile CCS development clusters and major transport & storage infrastructure projects – and a session on supply chain capabilities and innovation.
My talk was titled “CCS Development Screening – A Modern Toolkit” and aimed to offer new ways of understanding and exploring complex data to support good decision-making within organisations.
Insights on Belgium Carbon Emissions + Capture Developments
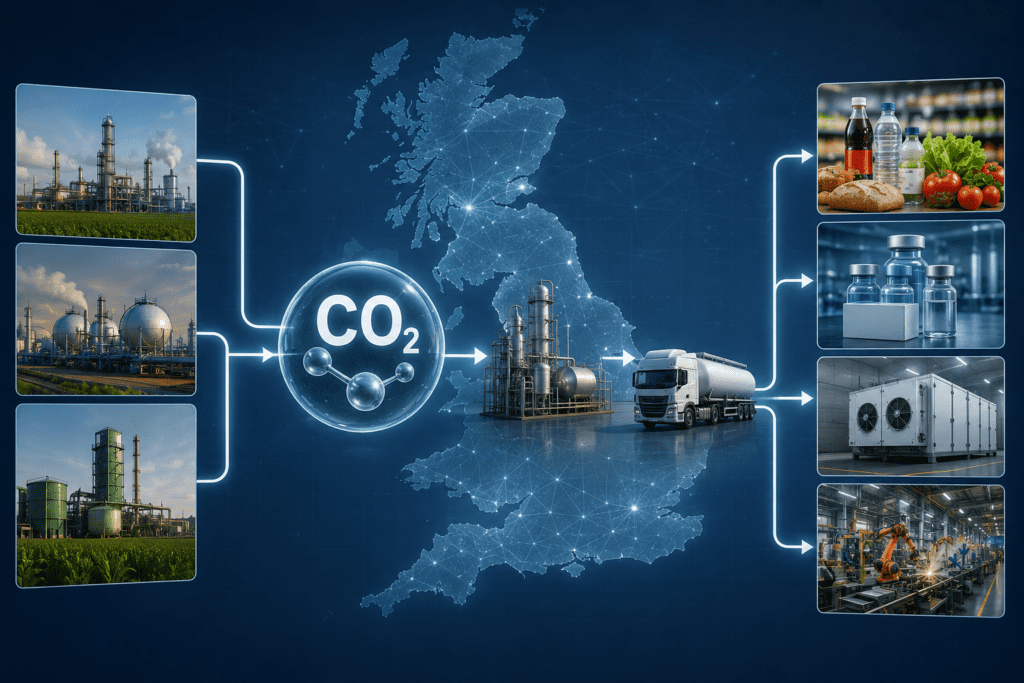
The Past: Our database of the top single-point CO2 emission sources for Belgium shows around 29 million tonnes of CO2 emitted per year across 49 sites. These are predominantly from the chemicals, cement, refining and metals sectors.
[When contrasted with the UK counterpart, our database of single-point CO2 emitters shows around 116 M te/yr of CO2 emitted across over 1500 sites, which are predominantly from the power, steel, refining, oil & gas, chemicals and cement sectors].
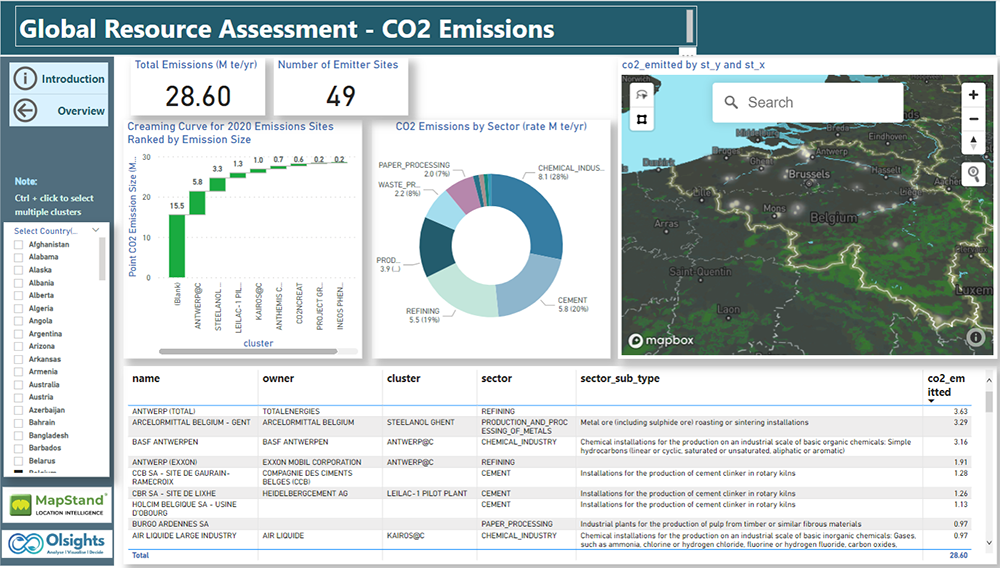
Belgium single-point CO2 emitters
The Present: Our database of identifiable carbon capture developments for Belgium shows around six million tonnes of CO2 captured per year by 2035 across 8 development sites. These are predominantly from the chemicals, refining and cement sectors.
[When contrasted with the UK counterpart, our database of carbon capture developments shows around 64 M te/yr of CO2 captured across 62 sites, which are predominantly from the hydrogen, power and refining sectors].
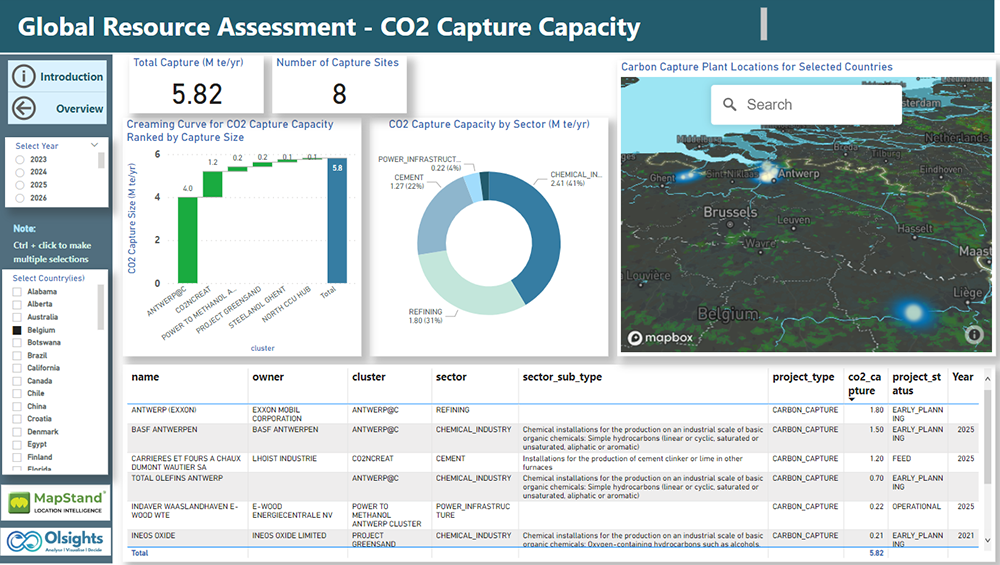
Belgium Carbon Capture Developments
The Future: Our carbon capture database for Belgium shows that 4.3 M te/yr CO2 of capture developments are currently in concept studies / early planning, and that 1.3 M te/yr CO2 has progressed to FEED / advanced planning. These are all currently expected to mature through the project lifecycle to be online by 2030 or shortly thereafter – and it is likely that in that period new carbon capture developments will be initiated to achieve net zero ambitions.
[When contrasted with the UK counterpart, our database of carbon capture developments shows that 50.2 M te/yr CO2 of capture developments are currently in concept studies, and that 13.8 M te/yr CO2 has progressed to FEED].
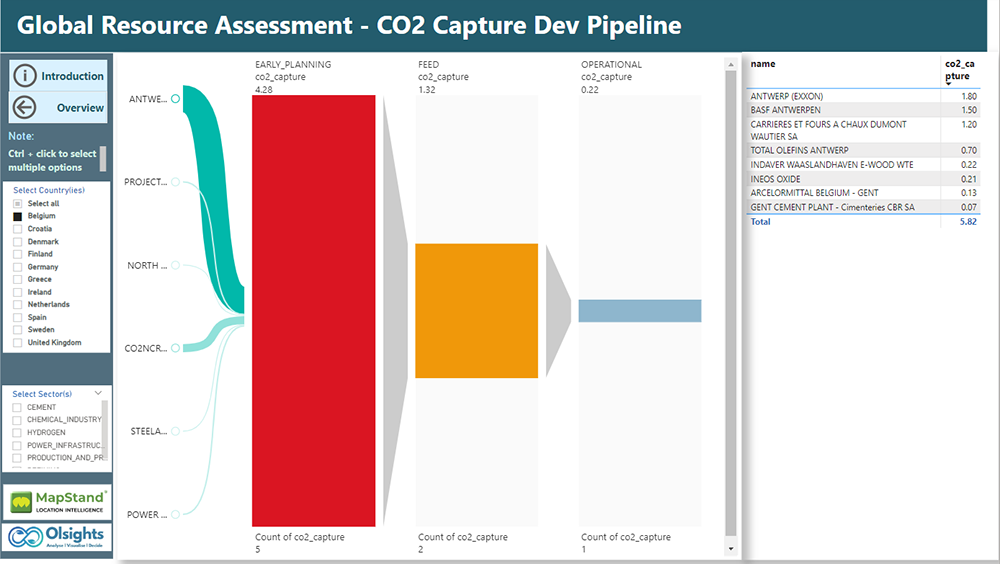
Belgium Carbon Capture Development Maturation
Insights on Belgium Hydrogen Developments
Hydrogen: This wasn’t presented at the seminar, but our database of identifiable hydrogen developments for Belgium shows 223 MW of hydrogen produced by 2035 across five development sites. These are all green (low carbon eletrolytic) hydrogen types.
[When contrasted with the UK counterpart, our database of hydrogen developments now shows around 18,000 MW of hydrogen produced by 2035 across 94 sites, which in capacity terms is 76% blue and 23% green hydrogen types].
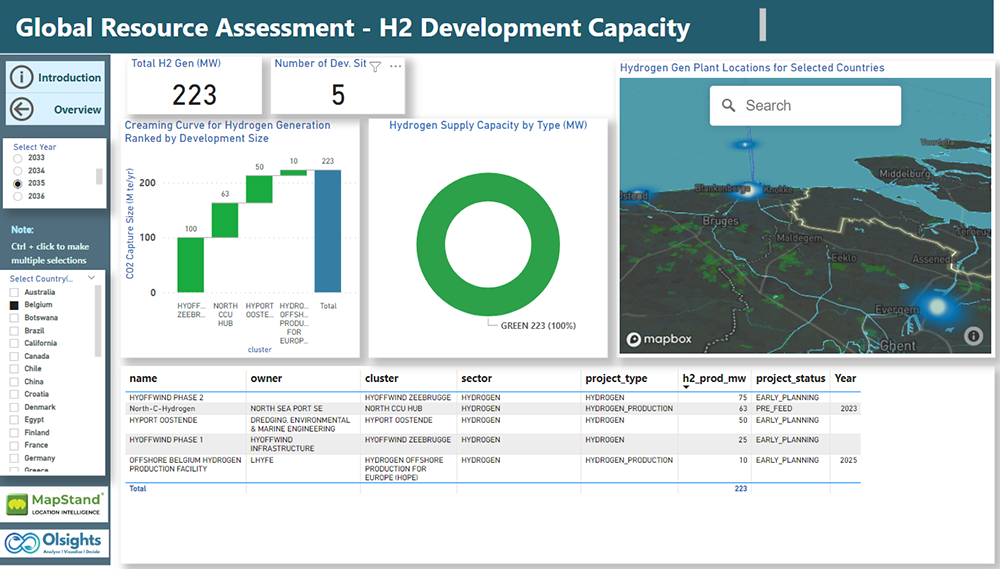
Belgium hydrogen developments
Conclusion
In summary, there is so much decarbonisation development & technology activity going on in both UK and Belgium – and I was grateful for the chance to share some of our own insights and innovative techniques with a European as well as a visiting UK audience.
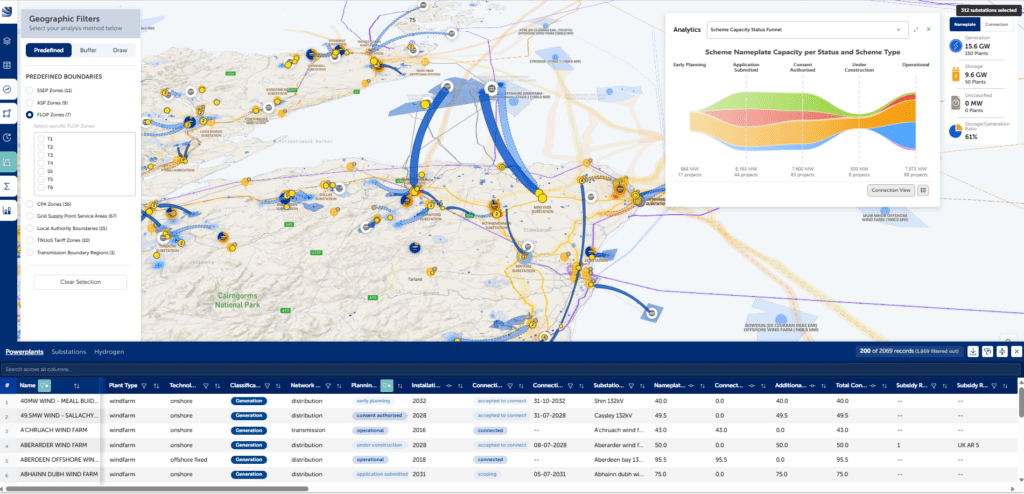
Contact us for a demo or access to these evolving interactive global analytic dashboards to help speed up development intelligence, screening or benchmarking – with ‘less waffle’ than traditional access to information.
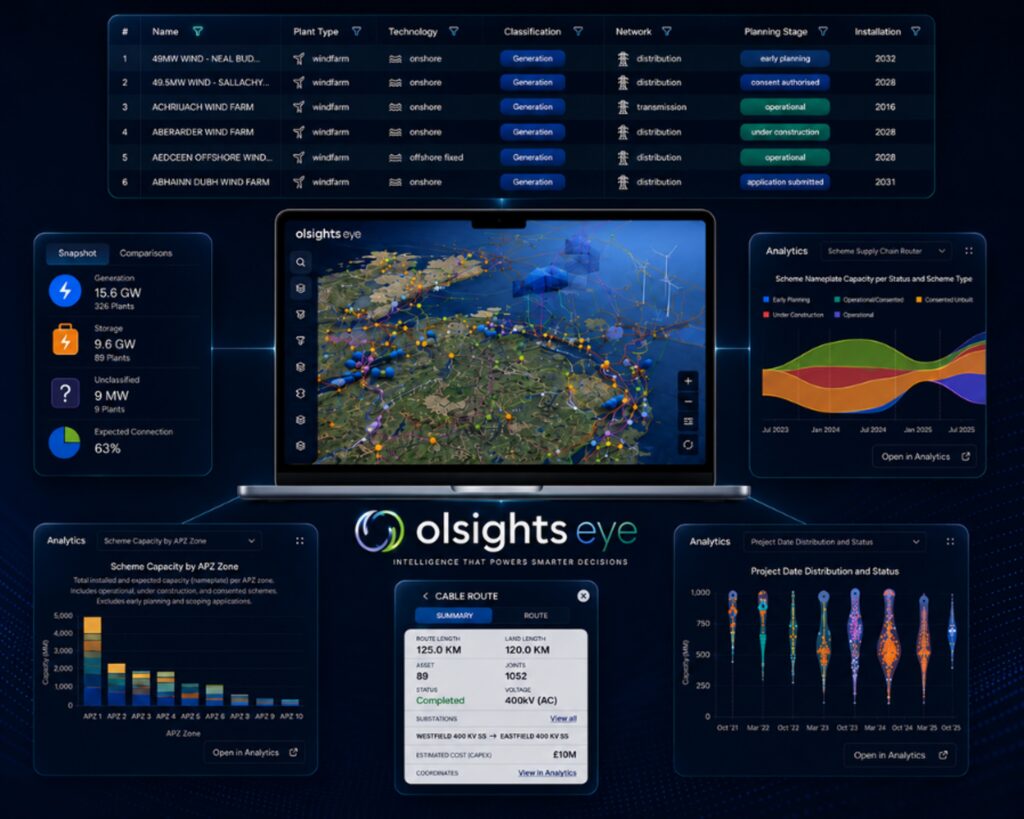
Our geospatial equivalent app Olsights Eye is also now out on public preview and can be freely accessed on any device with a web browser, although it is not yet fully optimised for mobile.
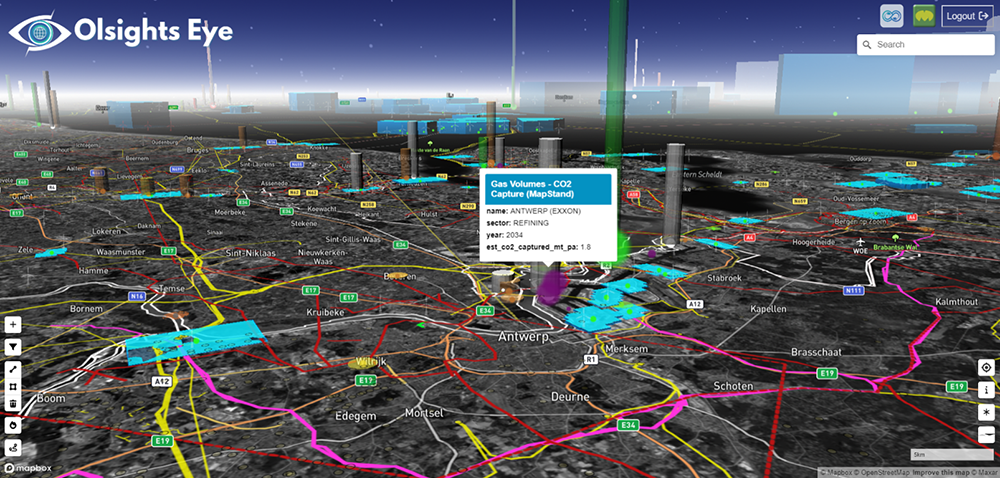
Olsights Eye view on Antwerp