Customize Consent Preferences

We use cookies to help you navigate efficiently and perform certain functions. You will find detailed information about all cookies under each consent category below.

The cookies that are categorized as "Necessary" are stored on your browser as they are essential for enabling the basic functionalities of the site. ... 

Always Active

Necessary cookies are required to enable the basic features of this site, such as providing secure log-in or adjusting your consent preferences. These cookies do not store any personally identifiable data.

No cookies to display.

Functional cookies help perform certain functionalities like sharing the content of the website on social media platforms, collecting feedback, and other third-party features.

No cookies to display.

Analytical cookies are used to understand how visitors interact with the website. These cookies help provide information on metrics such as the number of visitors, bounce rate, traffic source, etc.

No cookies to display.

Performance cookies are used to understand and analyze the key performance indexes of the website which helps in delivering a better user experience for the visitors.

No cookies to display.

Advertisement cookies are used to provide visitors with customized advertisements based on the pages you visited previously and to analyze the effectiveness of the ad campaigns.

No cookies to display.

Energy & Climate Data Visualisations

These open-source resources are gathered and shared to give an appreciation of some different creative ways that complex energy & climate has been visualised to aid understanding.​

Complexity of energy & climate data, considering the dynamic nature and geographical distribution of emissions and renewable resources presents a key challenge in posing solutions to decarbonisation, and designing systems or modelling realistic economics for future projects.

Contact Olsights for more information or to suggest additional resources to be added to the list.

Google and Amazon are now in the oil business

Google, Microsoft, and Amazon are teaming up with Big Oil to squeeze more oil and gas out of the ground using machine learning technology

Source: Vox (Youtube)
View Map

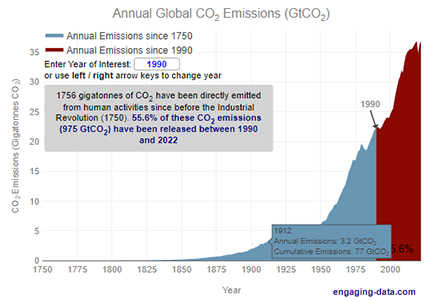
Cumulative CO2 emissions calculator

This shows the annual emissions of CO2 since 1750, before the industrial revolution. Due to rapid growth in population and energy use per capita over time, we’re emitting more CO2 each year: humans have emitted as much in last 28 years than the 240 years prior.

Source: Engaging-data.com
View Map

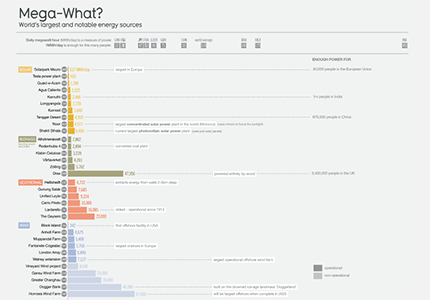
Megawhat?

How The World’s Energy and Electricity is Generated

Source: Informationisbeautiful.net

View Map

Solar (Sun) Intensity By Location and Time

This visualization shows the amount of direct solar insolation (W/m2) all across the globe as a function of time of day and day of year.

Source: Engaging-data.com
View Map

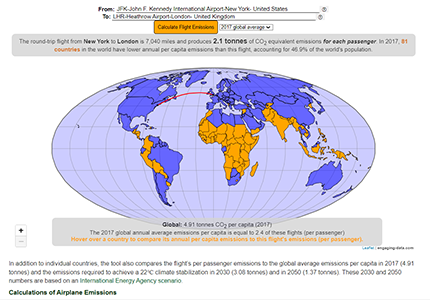
Greenhouse gas emissions from airplane flights

The following flight calculator and data visualization shows the miles and emissions produced per passenger by a airplane trip that you can specify.

Source: Engaging-data.com
View Map

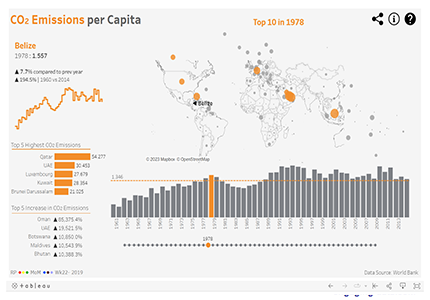
CO2 Emissions per Capita

Visualisation of World Bank CO2 emission data.

Source: Prasanna Ratnam (Tableau)

View Map

How America can leave fossil fuels behind, in one chart
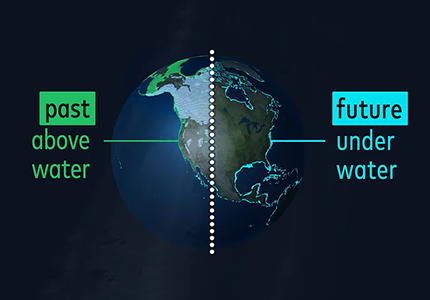
And what the US election meant for climate change

Source: Vox (Youtube)

View Map

A Skeptical Look at Climate Science

Degrees of Uncertainty is an animated data-driven documentary about climate science, uncertainty, and knowing when to trust the experts

Source: Neil Halloran (Youtube)
View Map

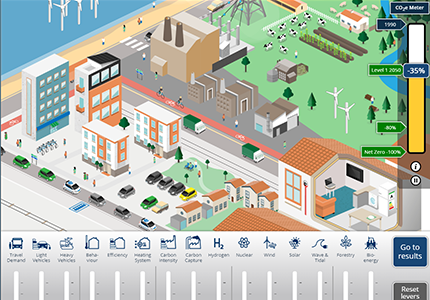
My 2050

Create Your Pathway to a Low Carbon UK By 2050

Source: BEIS

View Map

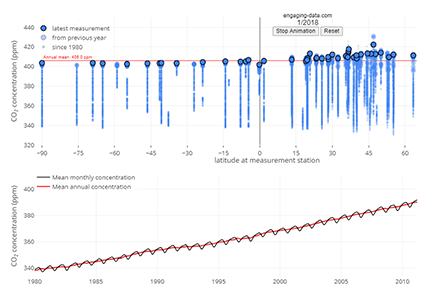
Visualizing The Growth of Atmospheric CO2 Concentration

This visualizes the growth in CO2 concentration in the atmosphere (mainly from emissions due to human activities, eg burning fossil fuels for energy production, deforestation + other industrial processes).

Source: Engaging-data.com
View Map

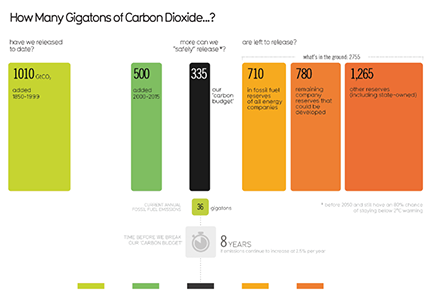
How Many Gigatons of Carbon Dioxide..?

have we released to date / can we safely release / are left to release?

Source: Informationisbeautiful.net
View Map

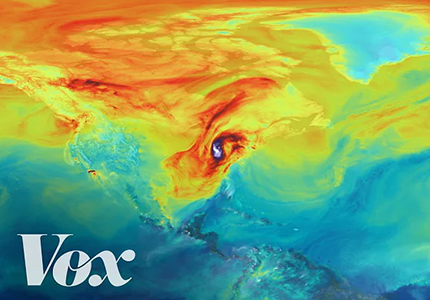
A visual tour of the world's CO2 emissions

A new high-resolution computer model created by NASA shows CO2, the greenhouse gas driving global warming, as you’ve never seen it before

Source: Vox (Youtube)

View Map

Analyse. Visualise. Decide.

Contact us for a demo of our applications or for more details how we can help with your clean energy or decarbonisation projects.