In recent months we’ve been looking a little more closely at the evidence for actual historic demand and use cases for hydrogen, and the range of published benchmarks for hydrogen production.
In short, large volumes of hydrogen are used as an industrial gas predominantly in refineries, ammonia (fertilizer) production, methanol and other chemical processes – and not very much else.
Cost benchmarks are highly variable – obviously because the composition of projects are – and many of the commonly-used costs reported are not intended to include compression or storage costs. This means that for applications such as transport, different benchmarks are needed or additional allowances made.
Actual Demand for Hydrogen
Currently (or at least by end 2020) 8.6 million tonnes per year of hydrogen is consumed in Europe, which is equivalent to 38.9 gigawatt on a ‘higher hear’ basis. We downloaded a dataset from the European Fuel Cells & Hydrogen Observatory (FCHO) which gives a breakdown per country and per industry sector – and put it into Power BI to take a closer look.
On a country by country consumption basis: Germany, Netherlands, Poland and Spain are the top four users, consuming a demand of 1.7, 1.3, 0.8 and 0.6 million tonnes per year each – and between them accounting for over half of Europe’s energy consumption.
Italy and UK have virtually the same hydrogen demand, with Italy just marginally higher than UK to make it the 5th largest consumer.
UK is the 6th largest consumer, with a usage of 518 thousand tonnes per year of hydrogen, which is equivalent to 2.3 gigawatt on a ‘higher hear’ basis. In these terms it is useful to compare against the UK’s Hydrogen Strategy (which, when published in Aug 2021, set an ambition of 5 GW hydrogen production by 2030) – and more recently the UK’s British Energy Security Strategy which has doubled the hydrogen ambition to 10 GW of hydrogen by 2050 (with half by electrolytic generation).
Ireland consumes approx. 1/70th of the hydrogen that UK does, and there are a number of countries that consume virtually none.
The shape of the country distribution can be shown in the screenshot below:

Europe total hydrogen demand by country
When considering all the countries across Europe, the 8.6 million tonnes per year of hydrogen consumed is used mainly in refining (50%), ammonia (29%), other chemicals (7%), methanol (5%), ‘Other’ (5%) and Energy (4%). Transport makes up for approx. 0.1%.
This industry sector breakdown varies somewhat from country to country, but in general follows a similar shape, with some variations. Poland for example consumes more for ammonia production than for refining.
In UK, the breakdown is refining (52%), ammonia (29%), other chemicals (10%), ‘Other’ (5%) and Energy (4%). None for methanol.
The shape of the industry breakdown can be shown in the screenshot below:
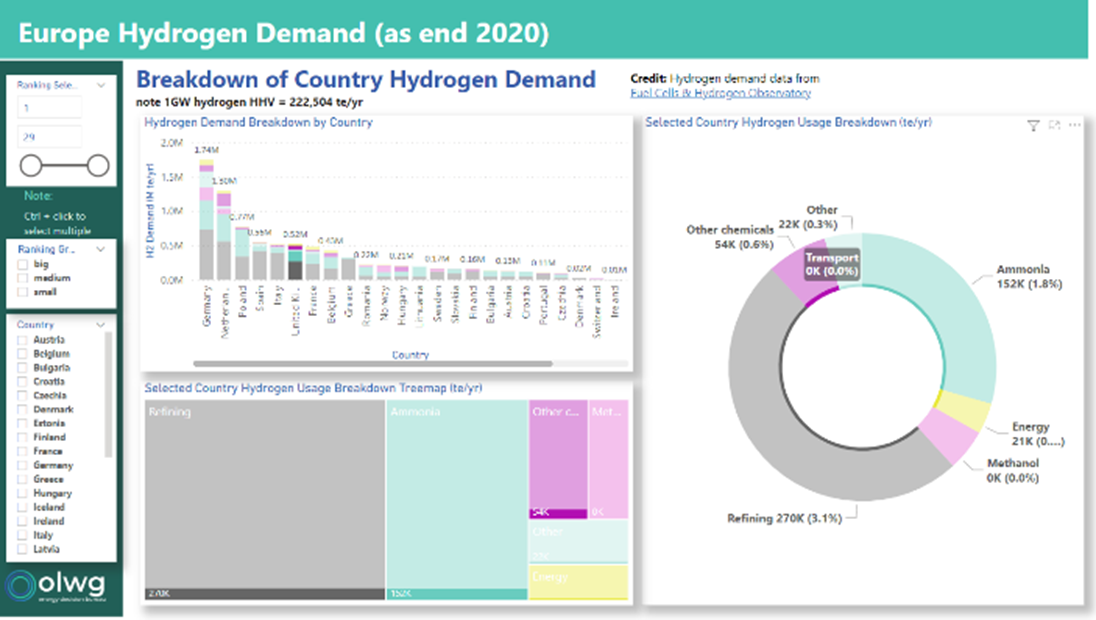
Europe total hydrogen demand by country
Benchmark Costs
Recently as part of an exercise to compare the predicted levelised costs of energy + hydrogen generation from an exciting marine energy-harvesting technology against benchmark electrolytic hydrogen costs, we took a closer look at published benchmarks. A broad range of recent views on hydrogen costs exist, and the main open references that were used in our analysis included:
- UK Dept for Business, Energy & Industrial Strategy (BEIS) Aug 2021: ‘Hydrogen Production Costs 2021’
- Bloomberg New Energy Finance (BNEF) Mar 2020: ‘Hydrogen Economy Outlook’
- Deloitte Investing in Hydrogen
- International Council on Clean Transportation (ICCT) June 2020: ‘Assessment of Hydrogen Production Costs from Electrolysis: United States and Europe’
- International Energy Agency (IEA) Jun 2019: ‘The Future of Hydrogen’
- International Renewable Energy Agency (IRENA) Dec 2020: ‘Green Hydrogen Cost Reduction Scaling up Electrolysers’
- FCH (Fuel Cells & Hydrogen): ‘Levelised Cost of Green Hydrogen’
- National Renewable Energy Laboratory (NREL) July 2020: ‘H2 Production Models’
After careful examination of these benchmarks, it became clear that they did not all represent ‘the same project’ or use consistent project scope, cost of electricity, discount rate or operating lifetime. Some of the references were more transparent than others in terms of explicitly stating the model assumptions. A number of observations were made during this exercise, and some of these are listed below:
Benchmark Levelised Cost Values:
- The 2023 PEM ‘Production Only’ benchmarks (BEIS, Lazard, NREL) give LCOH in the range £4.7 – £4.9 /kg. Note this represents the cost of an electrolysis plant delivering into a pipeline at electrolyser pressure, but not compression or storage.
- The 2023 PEM ‘Full-System’ benchmarks (Deloitte, ICCT) give higher LCOH in the range £9.3 – £10.2 /kg. This represents the additional cost of compression and storage plant as well as the additional energy costs of the compression.
- Alkaline costs are lower in 2022 – but many prediction expect PEM to become cheaper than alkaline over a longer time horizon.
- A PEM cost learning rate is generally modelled at 1-2% per year cost reduction to 2035 (real terms), then flattening off.
Challenges with Levelised Cost as a Metric
- Although the ‘levelised cost’ calculation is a great metric against which to compare the units costs of dissimilar projects over their lifetimes, this simplification can lead to inappropriate comparisons. There are many variables in the calculation – including the total project scope/ boundary, cost of electricity, the operating life, discount rate etc – so any comparisons made should be done with caution if the calculation variables are not known.
- ‘Levelised cost’ (LCOE / LCOH) is only useful in comparing the lifecycle cost of developments; the value metrics (which take into account revenue streams) may be more useful when LCOH is relatively high but the product can be sold at a premium or subsidies are available to encourage innovation.
- The difference between assuming a 20-year and 30-year operating life typically accounts for ~£1/kg LCOH.
- A discount rate of 10% is assumed by most models, but a lower discount will reduce the LCOH.
Reliability of Benchmarks
- At this point in time, with a limited number of real electrolytic hydrogen projects delivered, many of the future cost projections are speculative predictions, rather than true benchmarks.
Time will tell whether the future costs will be in line with these predictions, but the track record of long-term cost predictions shows that in general they quickly become out of date. - Most hydrogen ‘benchmarks’ are designed to show the cost of generating larger volumes of hydrogen for lower-pressure industrial usage, rather than compressing up to ~200 bar for tube trailers (which attracts both a higher CAPEX and internal energy usage).
The shape and distribution of the industry cost benchmarks can be shown in the screenshot below:
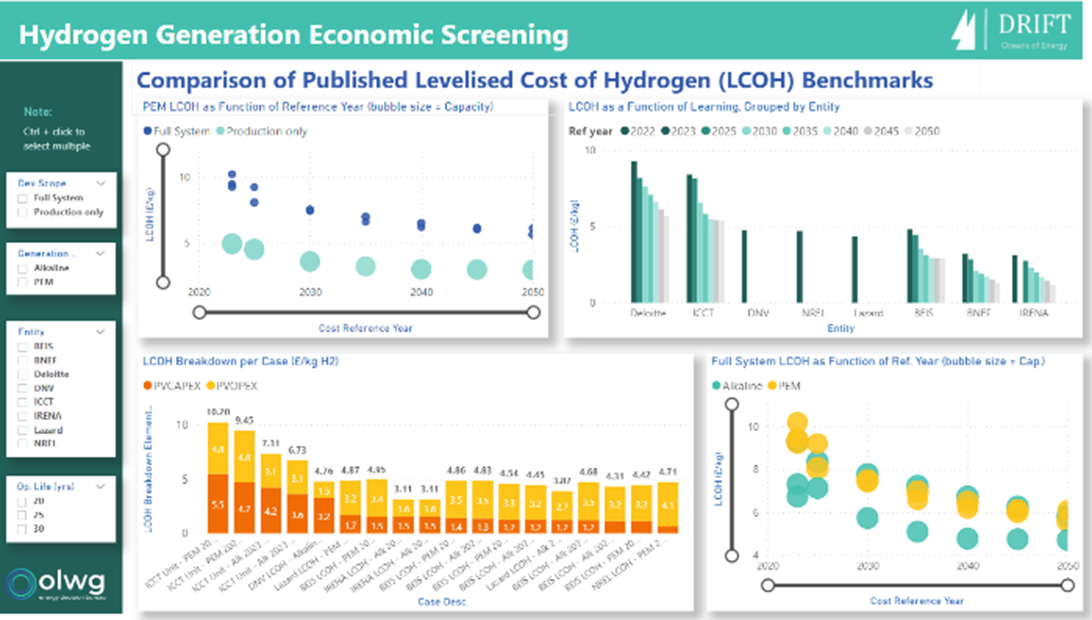
Comparison of published levelised cost of hydrogen
Conclusion
Almost all the actual demand for hydrogen has been – almost universally across all European countries – as an industrial gas for refining and as chemical feedstock for ammonia, methanol and other chemicals. There is not current evidence of hydrogen demand for fuel switching, transportation, home heating etc – and future demand for these sectors may be highly speculative. An immediate low-risk decarbonisation priority therefore should be to replace current hydrogen production and consumption with low-carbon hydrogen production ahead of creating new hydrogen demands.
We have discussed that using LCOH as a comparison metric for dissimilar projects should be used with caution, that the evidence for real electrolytic hydrogen benchmark project costs is limited – and that future cost reductions may be speculative. In terms of Future Project costs, so far in 2022 it has been observed that the costs of electrolysers, steel, energy etc are sharply going up not down.
Despite assumed steep learning curves modelled by many analysts, information from supply chain in 2022 is that steep optimistic cost reductions may not materialise, at least in the medium term.
Spreadsheets as a tool for large calculations and visualisation of outputs continue to be a pain, and the use of tools like Power BI to view data results and coded calculation routines offer a better more modern way to screen projects. Energy and gas units continue to confuse even seasoned engineers and analysts, and automatic unit converters + APIs could offer instant conversion as part of software packages.
We have summarised some common hydrogen-related energy conversions below for reference:
- 1 GW = 222,504 te/yr (or 0.22 M te/yr) = 8.76 TWh/yr hydrogen
- 1 M te/yr hydrogen = 4.49 GW = 39.37 TWh/yr
- 1 TWh/yr = 114.2 MW = 25,400 te/yr hydrogen
Contact us for access to these Power BI reports and for more insights on hydrogen – as well as interactive web applications that take the hard work out of comparing hydrogen units, costs and economics.


