Major Updates to the Olsights Eye: Enhancing User Experience and Control
We are excited to announce a series of significant enhancements to our data visualisation tools, designed to streamline workflows and improve the analytical capabilities available to our users. These updates focus on increasing clarity, control, and customisation across various datasets including Emissions, Capture Plants, Hydrogen, and Wind.
May 2024 Key Enhancements
1. **Refined Data Views**
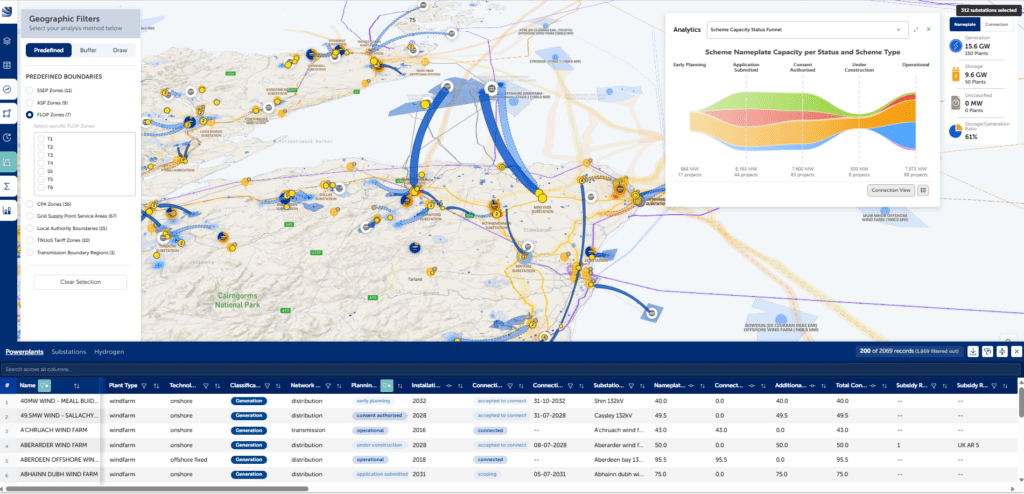
Understanding and isolating the primary datasets in each Data View is crucial. We’ve enhanced clarity by segmenting data more distinctly, allowing users to focus specifically on areas relevant to their work, whether that’s emissions data or wind energy analysis.
Each ‘Data View’ is a collection of relevant project or infrastructure layers. Selecting one loads the relevant default layers and sets the context to view the other options available.

2. **Context-Sensitive Filtering and Aggregation**
With our updated platform, the filtering and aggregation options are now dynamically adjusted based on the primary Data View selected. This means that users will see contextually relevant tools and options, making the data manipulation process both intuitive and efficient.
Depending on main Data View selected, contextual Data filters Layers may be selected or disabled to modify both the data shown on the screen and available for geographic analysis.
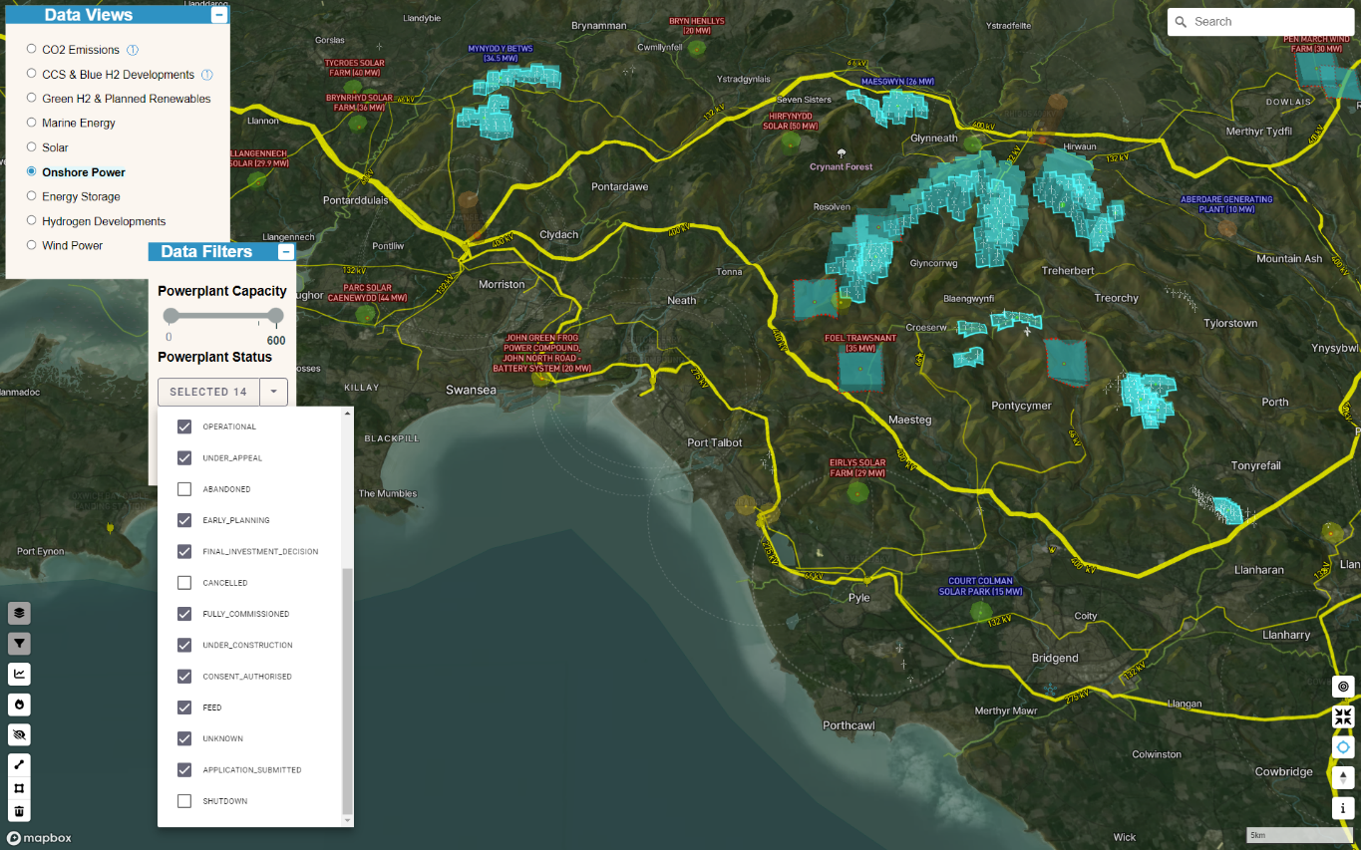
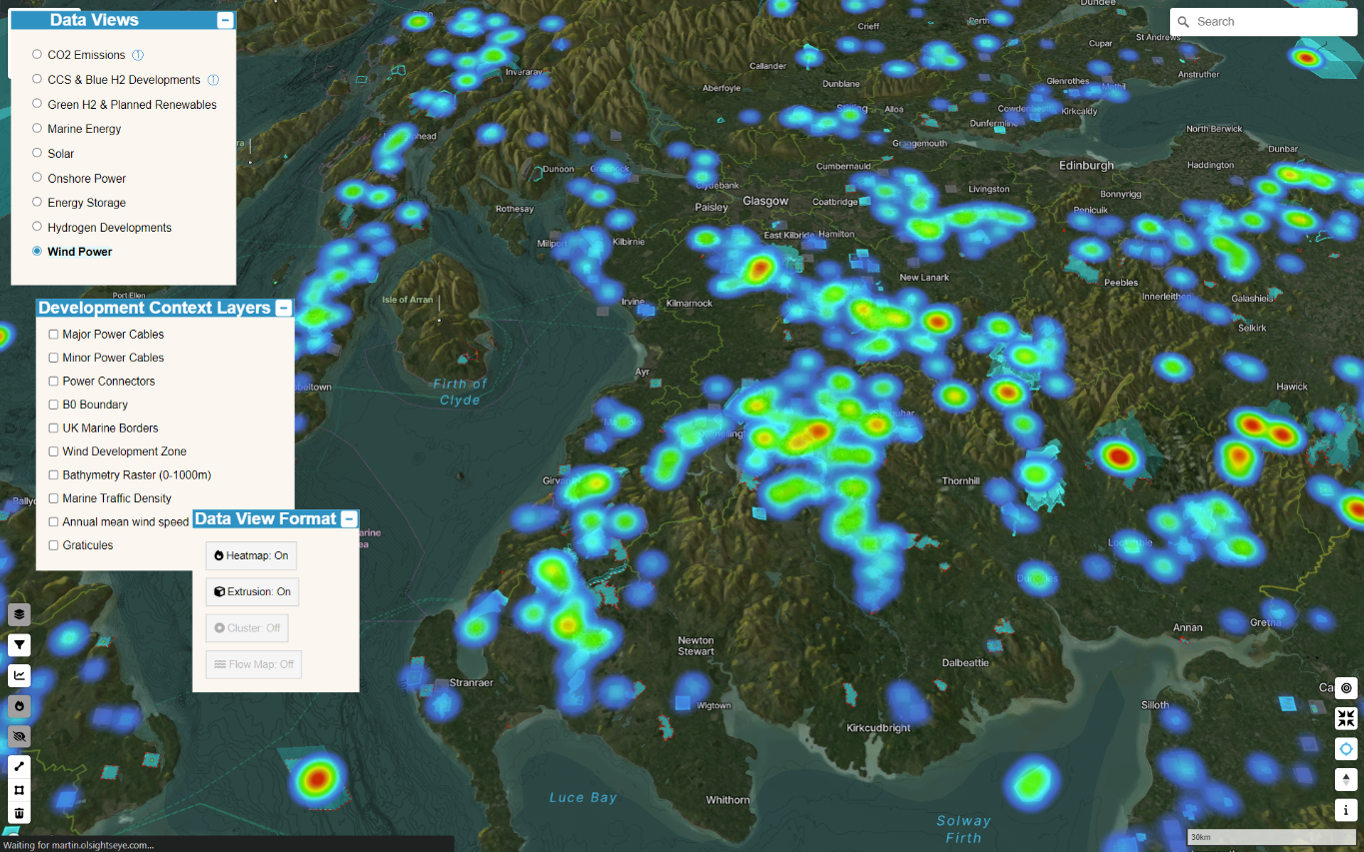
3. **Enhanced Control in Development Context Layers**
Users can now toggle additional data layers that supplement the core data, such as infrastructure or licensing details, or opt for a stripped-back view to focus purely on the primary data. This flexibility allows for a customised visualisation experience that caters to different user needs.
Depending on main Data View selected, custom Development Context Layers may be selected/ disabled to either add spatial context, or remove visual clutter.

4. **Flexible Data View Formatting**
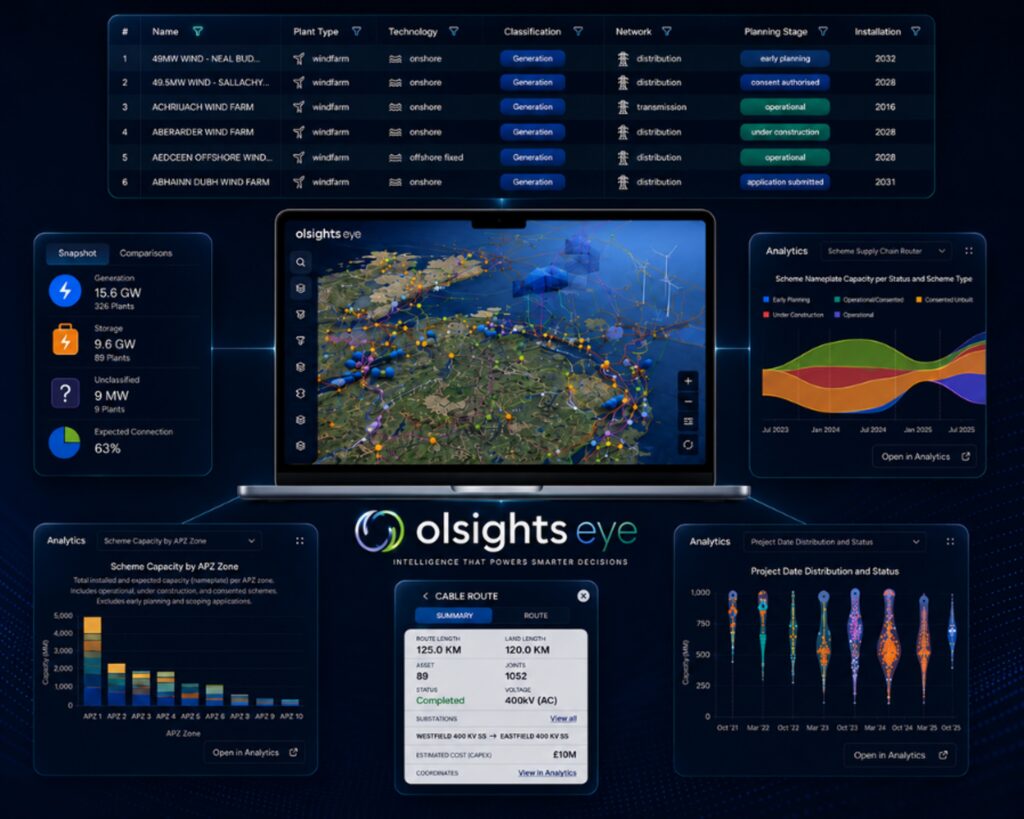
We have introduced the ability to customize how data points are visualised spatially within our platform. Users can activate heatmaps or 3D extrusions to suit their analysis needs, providing a richer, more dimensional view of the data.
The format of the key data points in the main Data View selected can be viewed in custom ways to assist with understanding of clustering – by toggling heatmap or 3D extrusions.
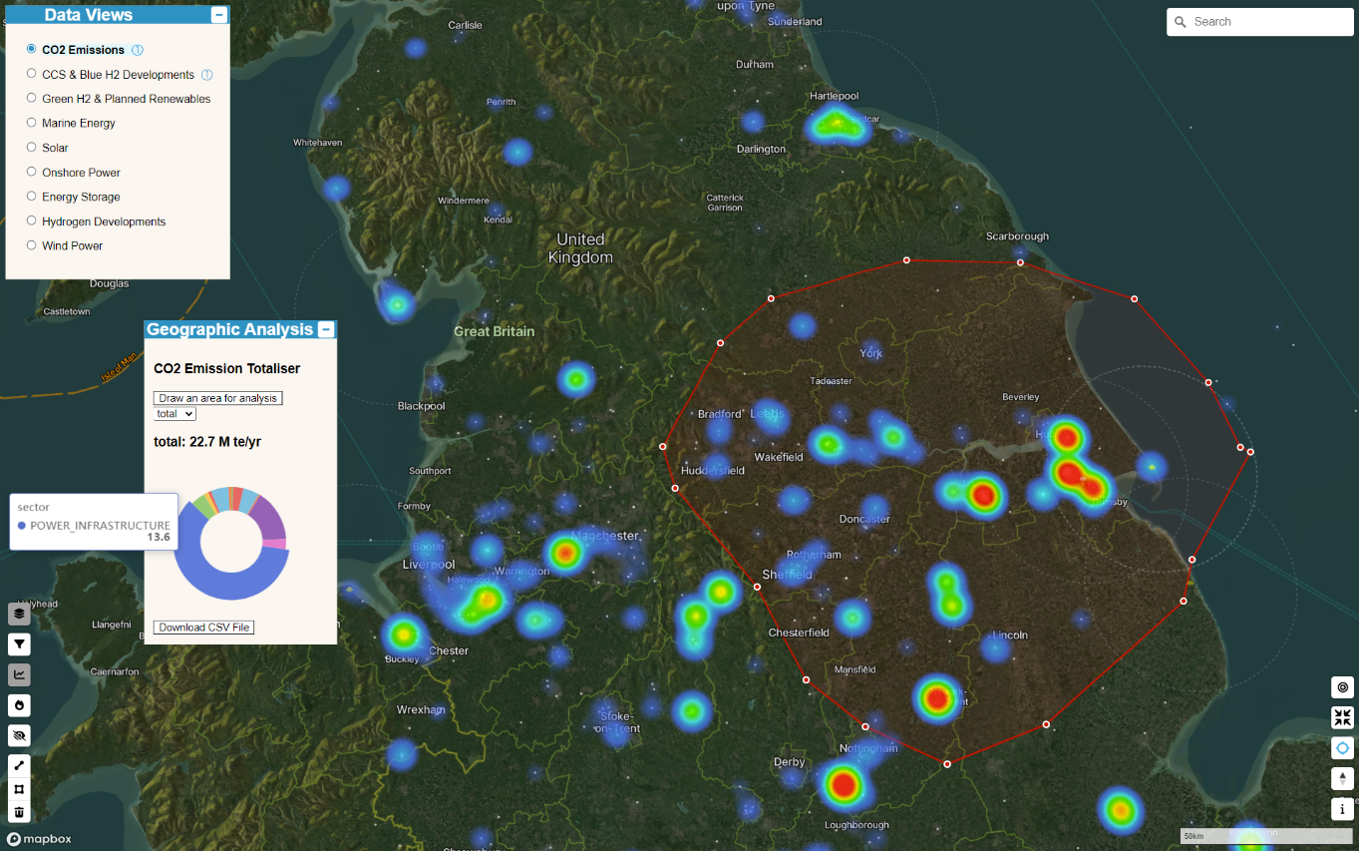
5. **Improved Geographical Analysis Tools**
The lasso tool and result calculator in our Geographical Analysis module have been upgraded for easier use, allowing for more precise data selection and quicker calculations.
Depending on main Data View selected AND Data Filters applied, custom geographic areas may be selected via the lasso tool to aggregate results and offer csv download.
Drawing out a polygon shape produces a totalised quantity (of emissions, renewable power etc) for that area, and a chart showing breakdown.
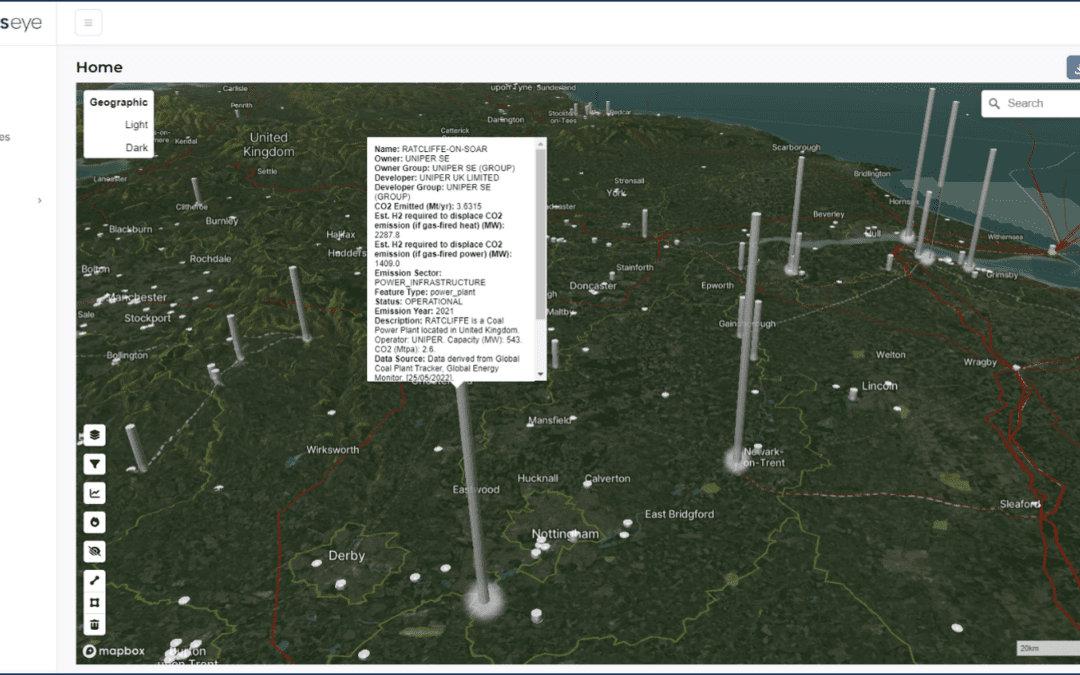
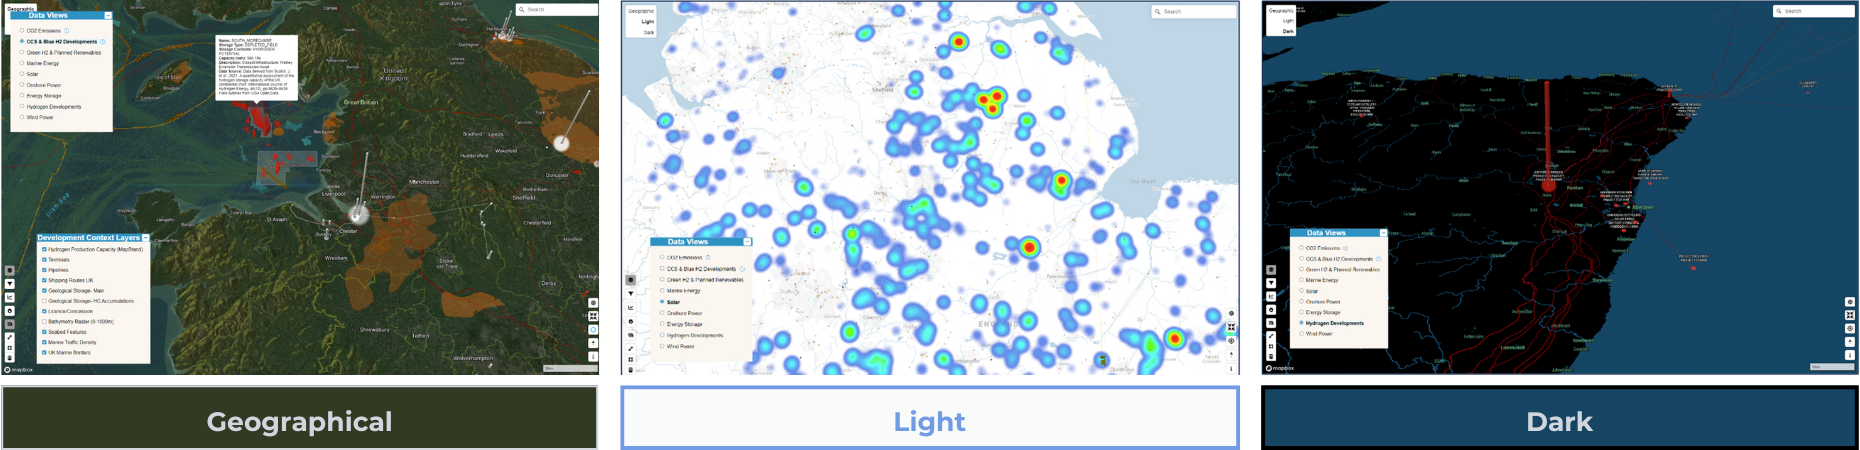
6. **Alternative Base Maps**
In addition to our traditional geographical base maps, we now offer simpler ‘Light’ and ‘Dark’ views. These new base maps reduce visual clutter, enhancing focus on the core data and facilitating a more straightforward analysis process.
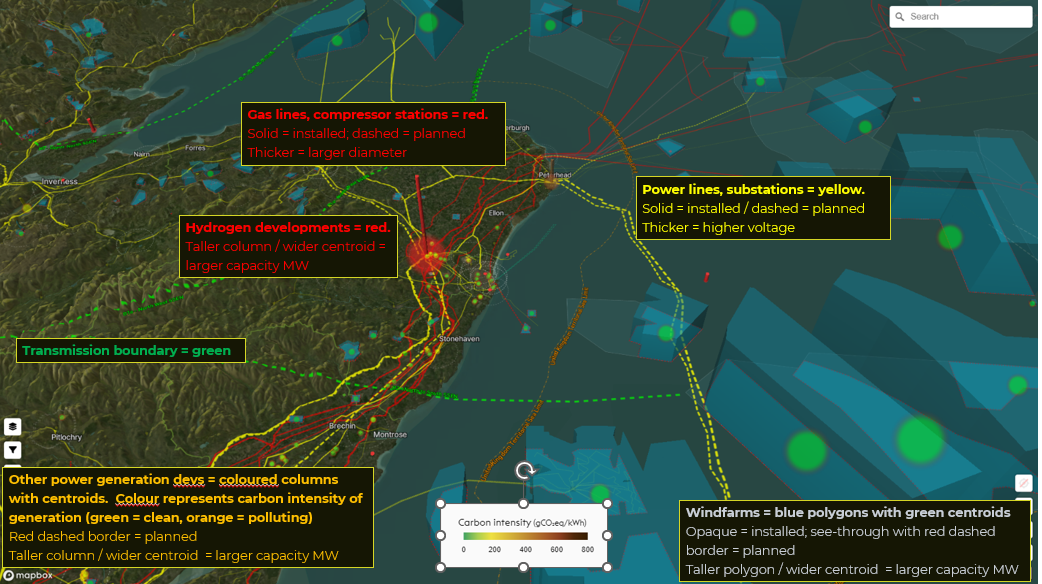
7. **Enhanced Colour-Coding**
Differentiating between various types of carbon and energy storage — such as salt fields, saline aquifers, and depleted hydrocarbon stores — is now easier with our improved colour-coding system. This update helps users quickly identify and differentiate between storage types at a glance.
What’s Coming Next In the Olsights Eye
Looking ahead to the rest of May, we’re excited about the upcoming additions:
- Cluster Style Visualisation: An alternative to the traditional heatmap, this new style will help users understand data clustering more intuitively.
- Geographic Measuring Tools: These tools will be enhanced to allow users to add data overlays per country, region, or local county, aiding in localized analysis.
- Improved Labelling and Styling: We are refining the visual styling of labels for developments and infrastructure to make them more informative and easier to read.
- Data Cables Layer: Understanding the colocation of Data Centres and energy projects will be simplified with the addition of a dedicated data cables layer.
We Want Your Feedback
As we continue to refine and expand our platform, your input is invaluable. Login to the Olsights Eye to try the new features and tells us what you find most useful. What would you like to see in future updates? Please share your thoughts and suggestions with us. Alternatively contact us for an in-depth demo with Technical Director Tony.