Beyond the PDF: Why Olsights is Building the Future of Energy Market Intelligence
At Olsights, we spend our days working with complex datasets, infrastructure intelligence and market information across the energy transition.
Every week, new projects are announced, supply chains evolve, investment patterns shift and policy changes reshape markets. The volume of information available has never been greater.
Yet one challenge remains constant:
How do you turn information into understanding?
For decades, the answer has largely been the same. Reports. Spreadsheets. PowerPoint decks. PDFs.
They remain valuable tools, but they were designed for a world where information moved more slowly.
Today’s energy markets move in real time.
By the time a report is published, new projects have emerged, investment decisions have changed and market conditions have evolved.
We believe the future of market intelligence needs to be different.
From Static Reports to Interactive Intelligence
Over the last few months, our team has been exploring a simple question:
What if market intelligence could be experienced rather than simply read?
What if complex topics could be explained through interaction, visualisation and exploration rather than pages of text?
What if the underlying data remained live, continuously updating as markets evolved?
To explore that idea, we challenged our team to build something different.
The result was our first interactive insight story:
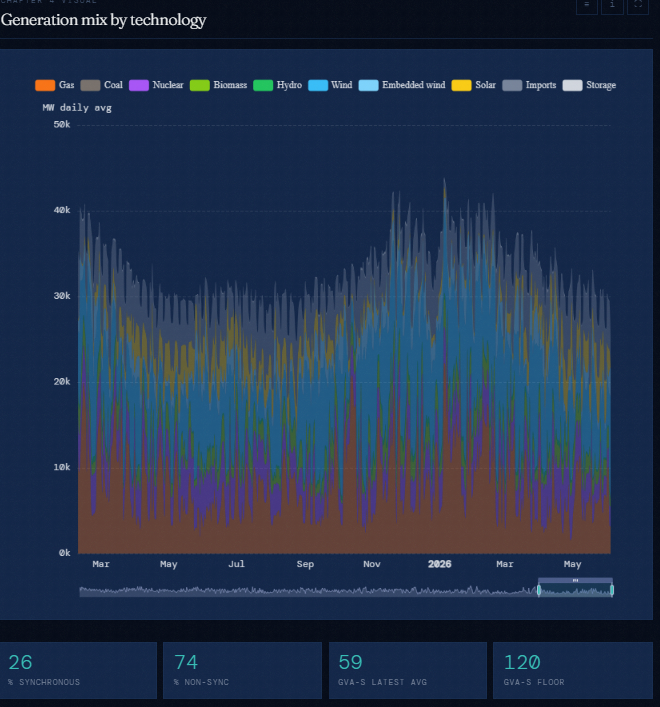
Britain’s Grid Is Getting Wobbly
Using open-source electricity system data, the team created an interactive experience explaining one of the most important – and often misunderstood – topics in the energy transition: grid inertia.
Rather than presenting charts and technical explanations in a traditional report format, the story guides readers through the problem step by step using interactive visualisations, simulations and live data.
The goal wasn’t simply to explain inertia.
The goal was to test a new way of delivering insight.
The problem with Traditional Reporting
The energy transition is becoming increasingly complex.
Whether you’re operating in:
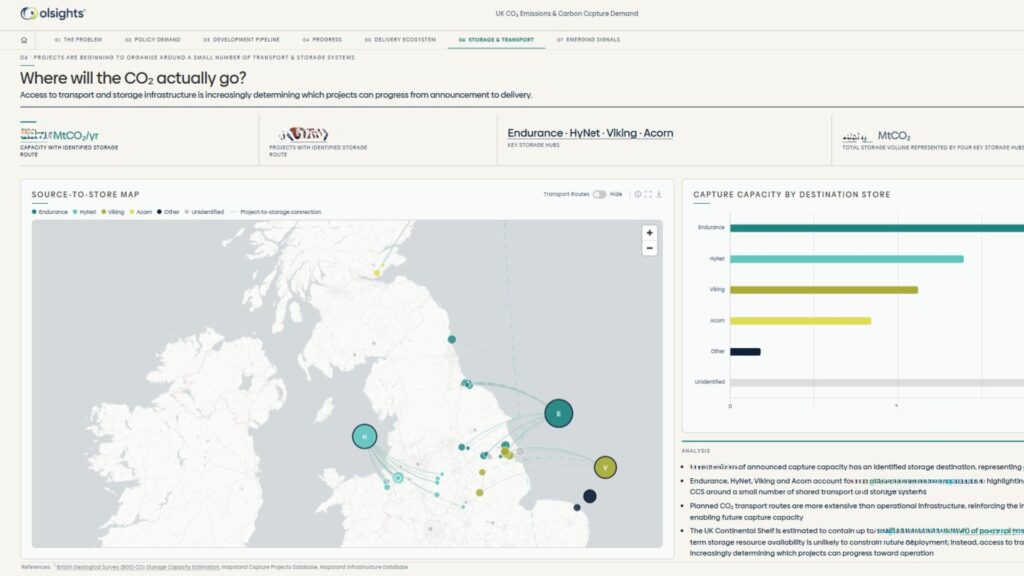
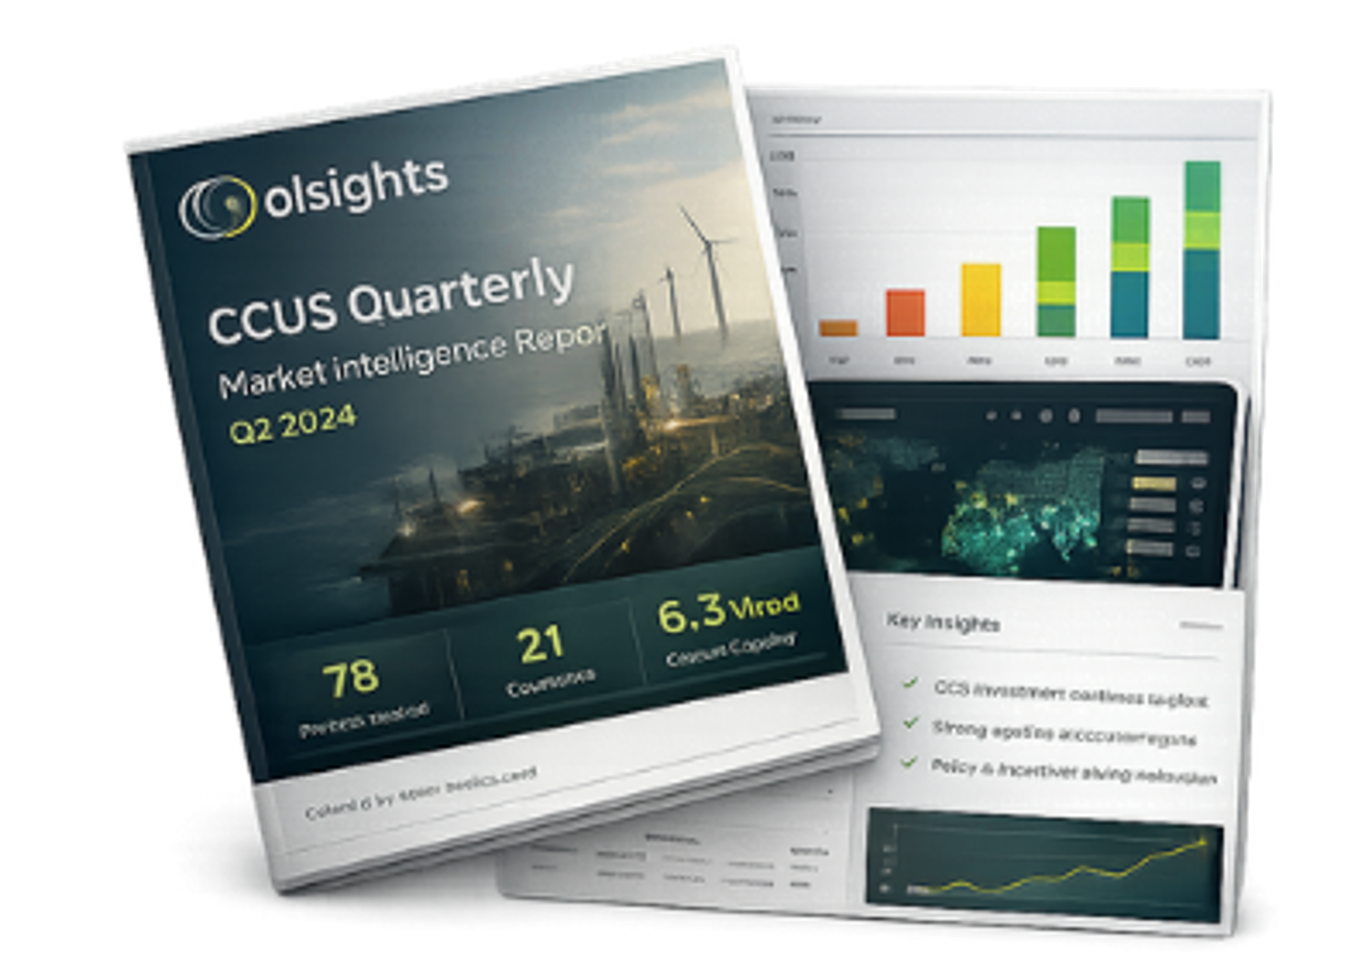
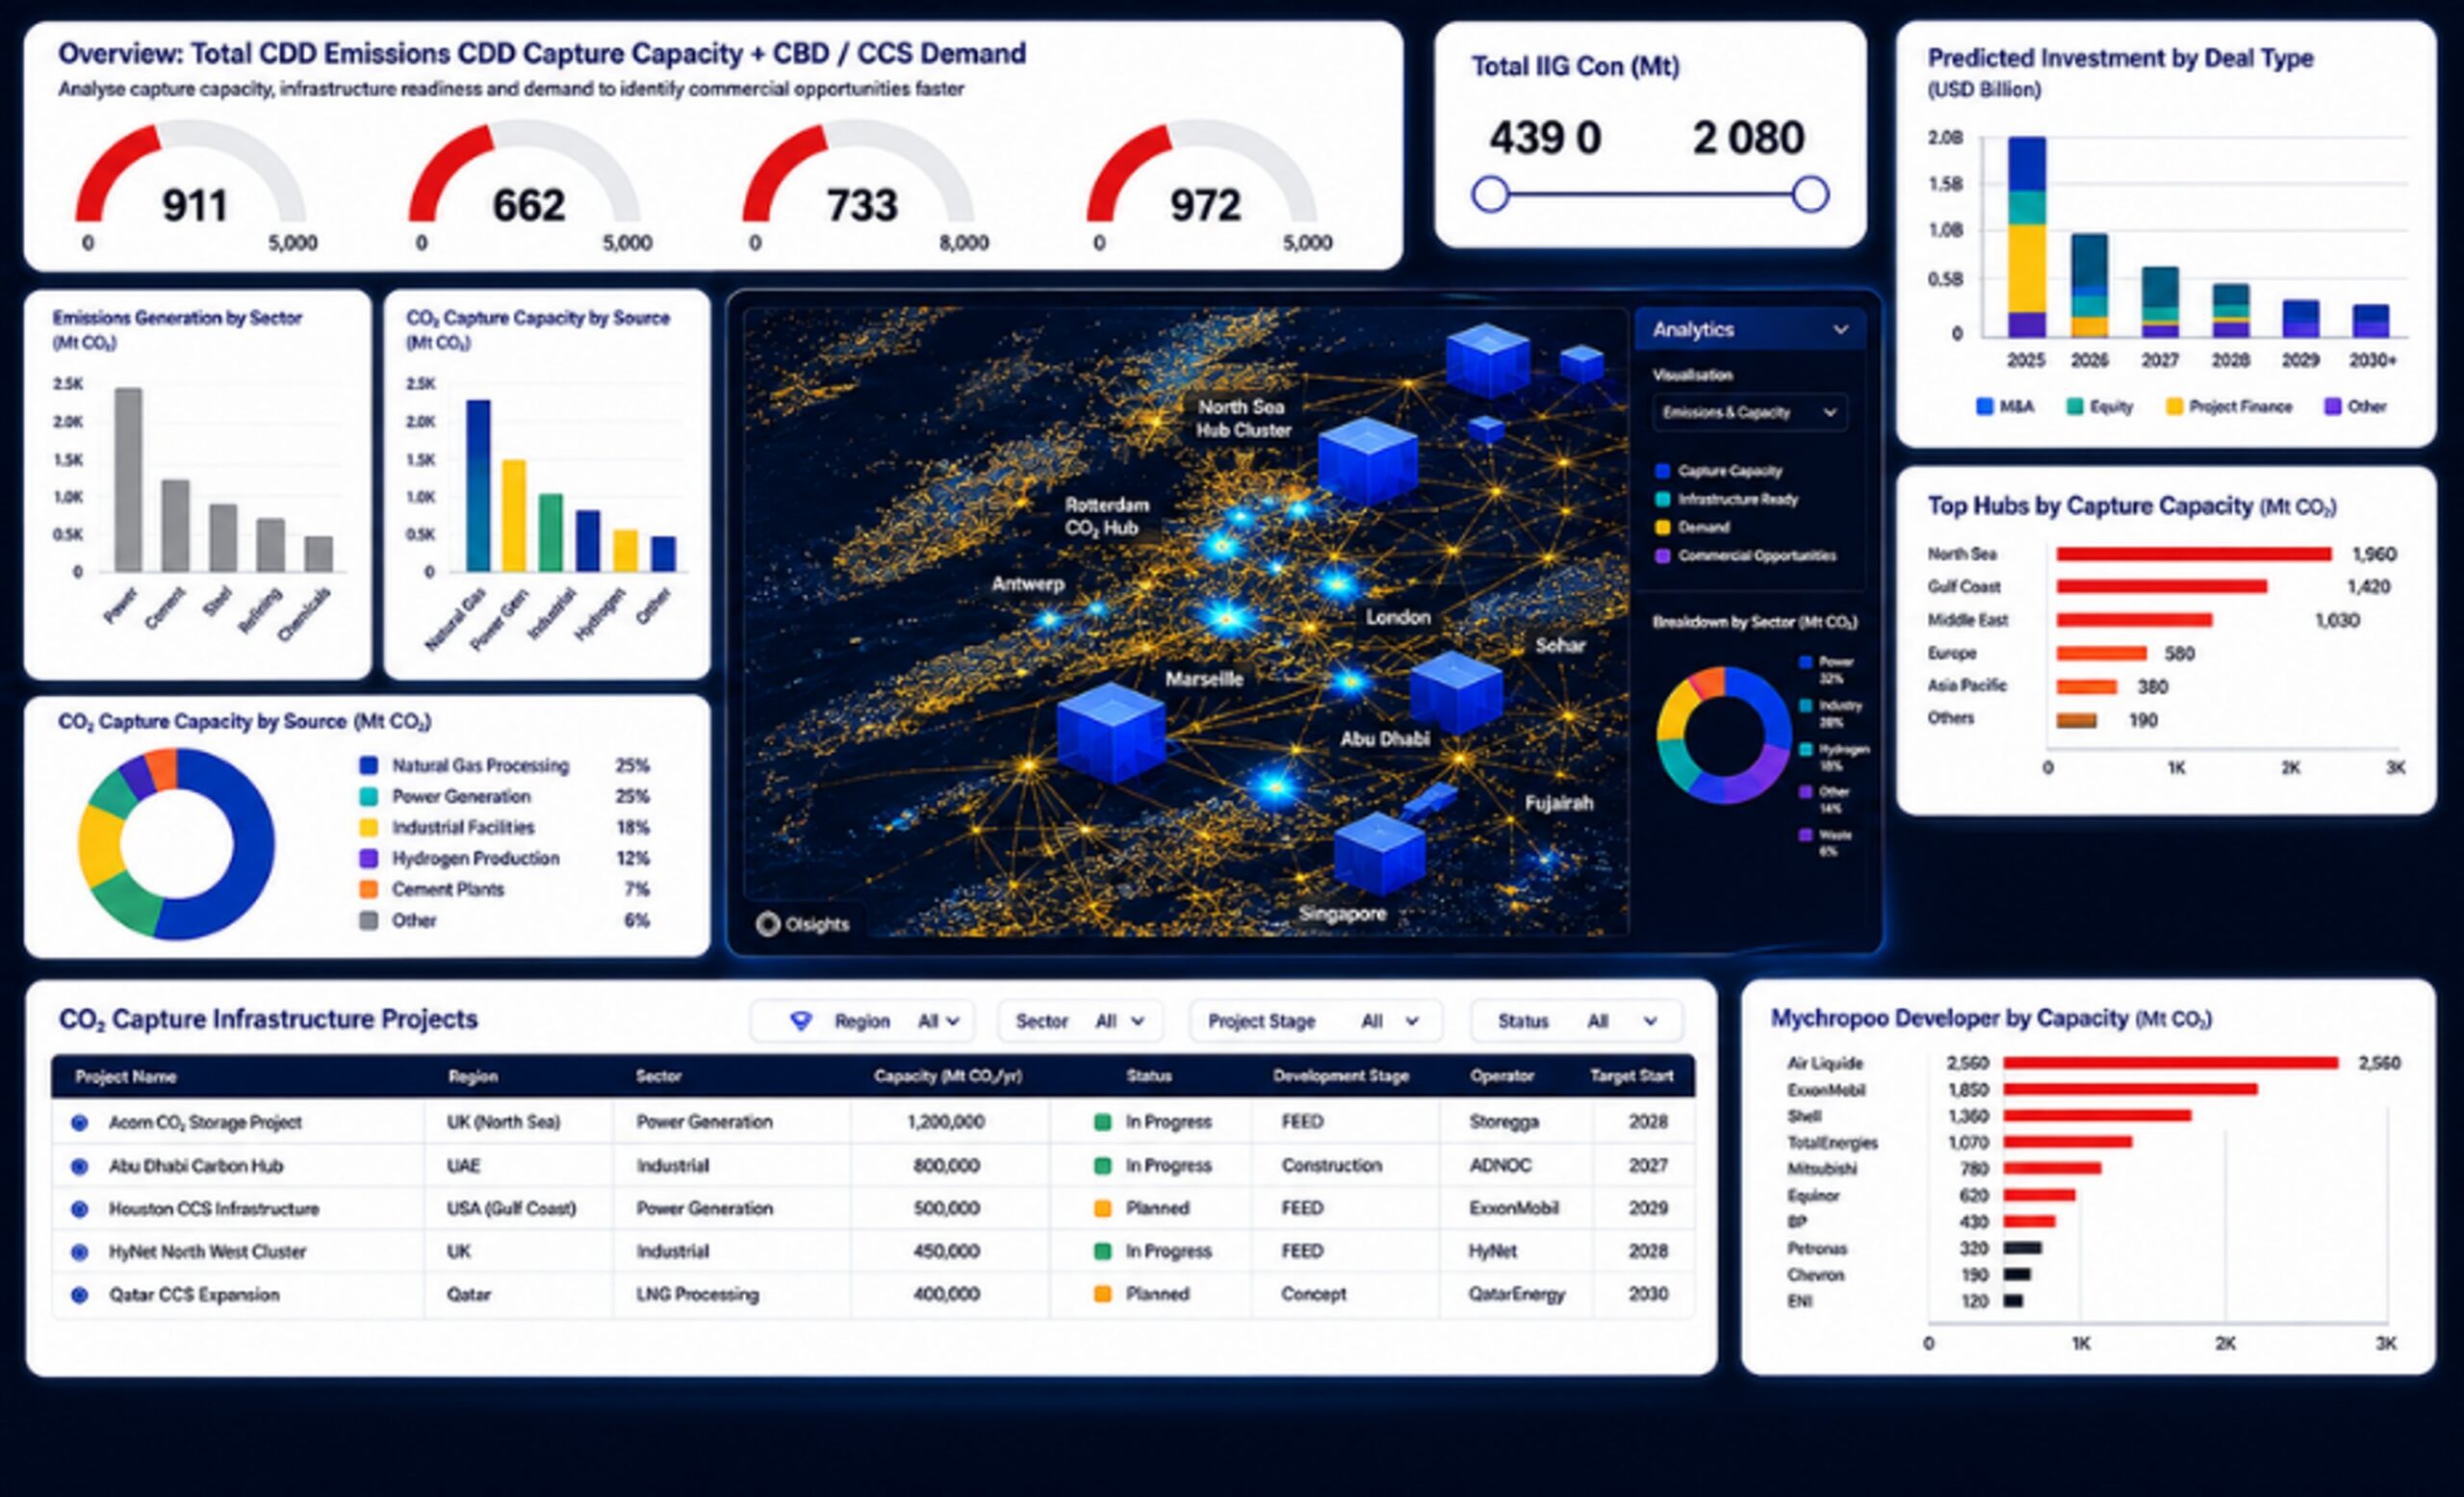
- Carbon Capture, Utilisation and Storage (CCUS)
- Hydrogen
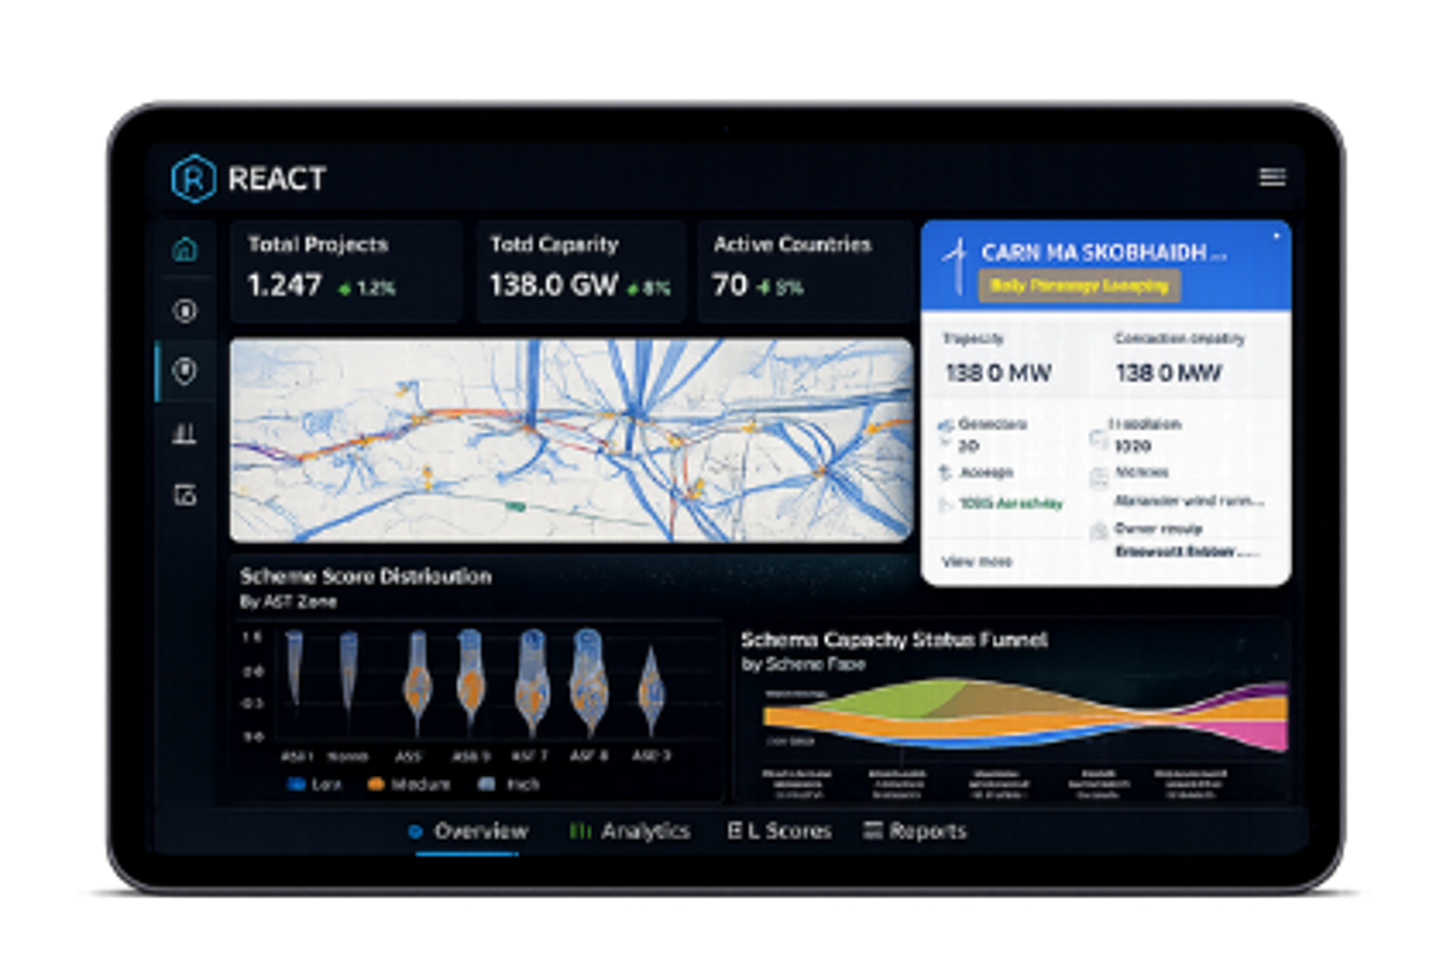
- Offshore Wind
- Battery Storage
- Grid Infrastructure
- Industrial Decarbonisation
understanding the market requires navigating huge volumes of interconnected information.
Projects, developers, supply chains, infrastructure, policy, funding and commercial opportunities all move at different speeds.
Traditional reporting often leaves organisations with two choices:
- Spend significant time conducting research internally.
- Purchase static reports that quickly become outdated.
We believe there is a better option.
Building a New Generation of Insight Products
The inertia project represents the first step towards a broader vision.
We are developing a new generation of digital insight reports that combine:
- Live market data
- Interactive visualisations
- Expert analysis
- Project intelligence
- Supply chain intelligence
- Dynamic exploration tools
The objective is simple:
Give organisations the intelligence they need without the research burden.
Rather than reading hundreds of pages of reports, users can immediately explore the information that matters to them.
Rather than searching multiple sources, they can access connected intelligence in a single place.
Rather than waiting for the next quarterly update, they can work with information that continues to evolve.
What’s Next?
Over the coming months, we will be expanding this approach into a growing portfolio of digital insight products.
Planned areas include:
- CCUS market intelligence
- Hydrogen market intelligence
- Offshore wind intelligence
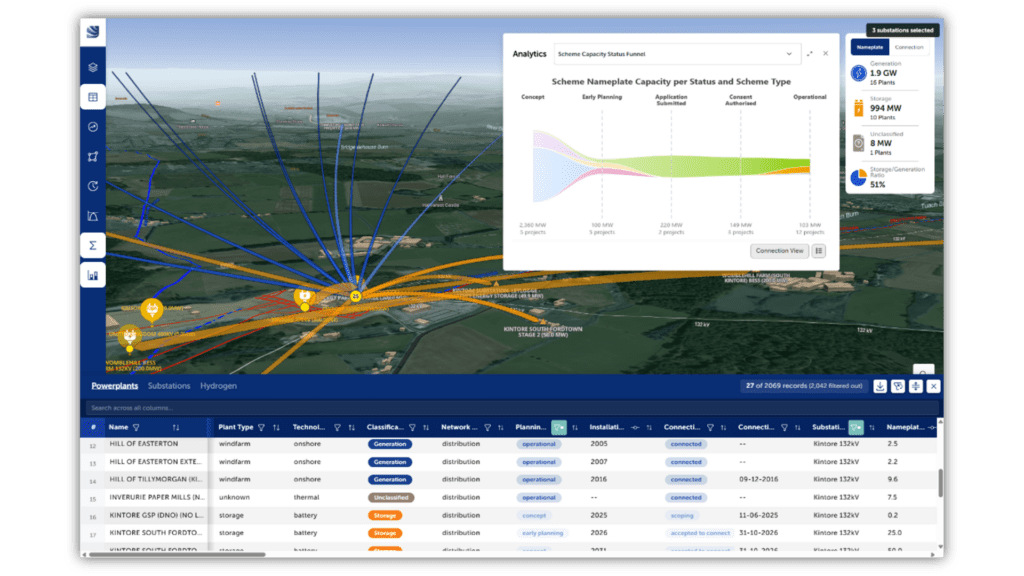
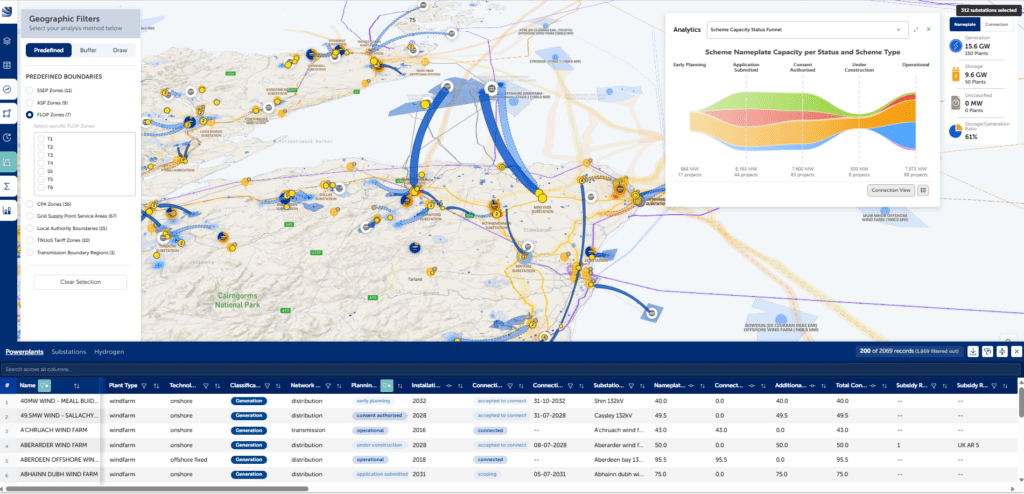
- Grid and power infrastructure
- Supply chain opportunity mapping
- Industrial decarbonisation
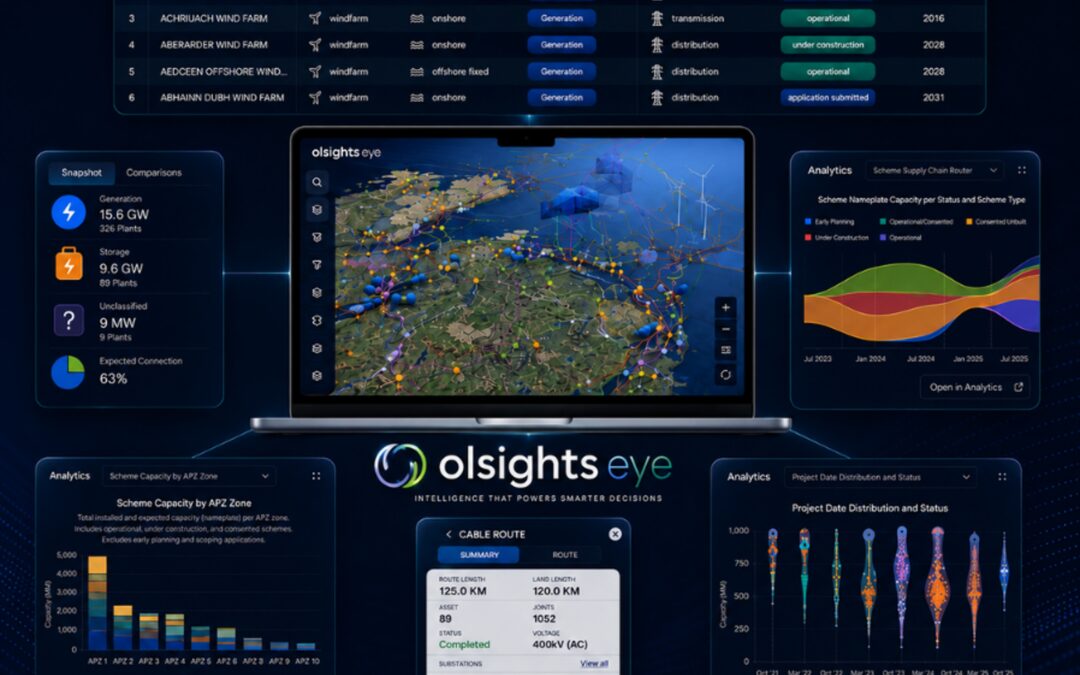
Each will combine Olsights’ expertise in data visualisation, engineering and market intelligence to provide a more accessible way of understanding complex markets.
Bespoke Intelligence Experiences
Not every organisation needs the same view of the market.
That’s why we’re also developing the capability to rapidly create bespoke intelligence applications and digital reports tailored to specific customer requirements.
Whether you need:
- A market-entry intelligence portal
- A supply chain opportunity tracker
- A project monitoring dashboard
- A technology-specific insight report
- A customer-facing intelligence product
our platform allows us to create custom experiences far more quickly than traditional reporting approaches.
The Future of Energy Market Intelligence
We don’t think the future of market intelligence is another 50-page report.
We believe it’s interactive.
We believe it’s visual.
We believe it’s connected to live data.
Most importantly, we believe it should help people move from information to understanding faster.
The inertia project is only the beginning.
As Olsights continues to develop new digital insight products, our goal remains the same:
Turn complex market data into clear, actionable intelligence.